
Dolt is a MySQL-compatible server with Git-style version control.
Users want to use Dolt as a drop-in replacement for MySQL or as a replica for their MySQL database. For this to work, we need to be correct: all user queries should have the same results running against Dolt that they do running against MySQL. But it also needs to be fast.
How fast?
We don’t promise to be as fast as MySQL. In fact, we are approximately 2X slower than MySQL using our suite of industry standard sysbench tests. The novel storage layer that powers Dolt’s efficient versioning system sometimes forces us to make tradeoffs. But we strive very hard to strike a balance between fast queries and fast version control capabilities. Common operations should be as fast as MySQL, and other operations should be almost as fast as MySQL. We decided that 3X performance was our limit: if a query runs more than three times as slow on Dolt than on MySQL, then we treat that like a Dolt bug.
Let me tell you a story about how we’re closing the MySQL performance gap.
We’ve talked before about debugging slow queries in Dolt. This is a story just like that. It has everything that makes a good story: high stakes, flame graphs, plot twists, a new physical plan for join operations, and a steamy romance. (Okay, there’s no steamy romance in this story. But I can dream.)
Allow me to set the mood.
Chapter 1: The Postgres Always Rings Twice#
The rain fell in sheets, painting the city in a shimmering haze of neon and melancholy. I was used to the low-tempo melody of raindrops against the window, but tonight, it seemed to carry an air of foreboding.
The door creaked open, and a figure emerged from the murky gloom of the hallway. “I’m in trouble, ” they said. “It’s my database. I use Dolt, the world’s first and only version-controlled SQL database. And we love it. It’s great for reliably and effortlessly running analyses on historical data and comparing them to the present day. But one of my queries is slow. About twice as slow as when we run it in MySQL.”
It’s a familiar story. These days, everyone wants a MySQL-compatible database with built-in version control. And you can’t throw a rock without striking a database query that needs to be made faster. It’s a dance I’ve done a thousand times before. And I was about to do it again. “Alright, I’ll take the case,” I told them. “But I warn you, databases can be treacherous. Commit the wrong transaction and you could lose valuable data.”
“Not with Dolt,” the client explains. “Dolt keeps a commit history, just like Git does. We can revert to a previous commit at any time.”
“Oh. That’s useful. Now tell me more about this query.”
Here’s an abbreviated version of the query:
SELECT *

FROM appointments

LEFT JOIN member_appointments
    ON appointments.ma_id = member_appointments.id

LEFT JOIN users
    ON member_appointments.user_id = users.user_id

LEFT JOIN invoices
    ON member_appointments.id = invoices.member_appointments_id

LEFT JOIN employee
    ON member_appointments.employee_email = employee.email

LEFT JOIN customer_rates ON (
        invoices.payment_type = 'Monthly'
    AND customer_rates.start_date <= member_appointments.start_date
    AND member_appointments.start_date <= customer_rates.end_date
    AND invoices.bank = customer_rates.bank
    AND employee.certification = customer_rates.certification
    AND member_appointments.service = customer_rates.service
    AND customer_rates.archived_at IS NULL
)

LEFT JOIN default_rates ON (
        default_rates.created_at <= member_appointments.start_date
    AND member_appointments.start_date < default_rates.ended_at
)
The full query was a join of fourteen tables, and ran in about four minutes. When the same data was imported into MySQL, the query ran in about two minutes. So why were we so much slower? What exactly happens behind the scenes during a join operation that can cause a slowdown like this?
Joins: A Primer
(If you’re already familiar with joins in relational databases, feel free to skip this.)
A join is a binary operation between two tables
aandbthat finds every combination of a row fromaand a row fromb, that satisfies some constraint. (The constraint is called a “join filter”.) A join between fourteen tables is really just thirteen binary joins, where the result of one join gets fed into the next join.So this query is essentially a pipeline of thirteen join operations. With profiling, we identified that just two of the joins were responsible for the majority of the runtime: each of them took about ninety seconds to execute, while the remaining eleven joins run in about a minute total.
A useful tool for identifying performance bottlenecks is a flame graph. A flame graph is a visual representation of how much time a program is spending in each function, created by sampling the program’s call stack at regular intervals. Here’s what a flame graph of Dolt looks like as it executed this query:
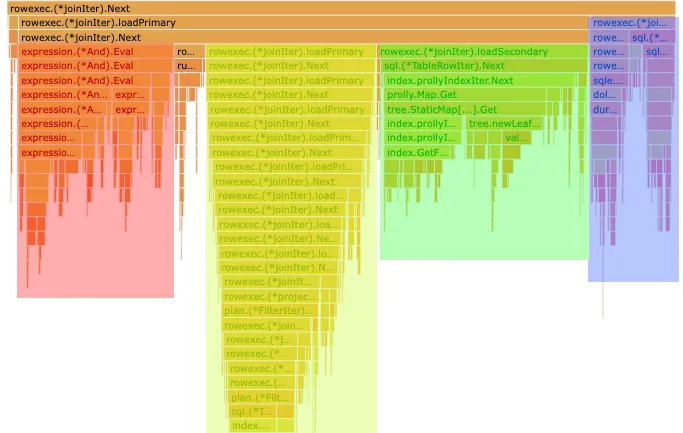
The blue section is the time spent fetching the rows from the default_rates table. The green section is the time spent fetching the rows from the customer_rates table. The red section is the time spent evaluating the join conditions for the join with customer_rates. And the yellow section is the other 12 join operations combined. It seems that just two of these joins are responsible for almost 75% of the runtime.
These were the two joins causing the bottleneck:
LEFT JOIN customer_rates ON (
        invoices.payment_type = 'Monthly'
    AND customer_rates.start_date <= member_appointments.start_date
    AND member_appointments.start_date <= customer_rates.end_date
    AND invoices.bank = customer_rates.bank
    AND employee.certification = customer_rates.certification
    AND member_appointments.service = customer_rates.service
    AND customer_rates.archived_at IS NULL
)

LEFT JOIN default_rates ON (
        default_rates.created_at <= member_appointments.start_date
    AND member_appointments.start_date < default_rates.ended_at
)
There’s an obvious difference between these joins and the others. The fast joins all had filters that checked whether columns on the input tables were equal, while the two slower joins had filters that checked whether one column was between two others. These faster joins, the joins that only check for equality, are very easy for database engines to optimize.
In database software, the actual algorithm used to implement a specific logical operation is called a “physical plan.” There are multiple physical plans that allow for computing joins efficiently when the join filter is an equality check like this one. In this case, all of the fast joins were being implemented by the “Lookup Join” physical plan, also called an “Indexed Join”. If you want, you can read a lot more about how Dolt implements and optimizes lookup joins here, but the important takeaway is that SQL tables have indexes which enable the engine to quickly find all rows with a specific value (called a “point lookup”) or all rows within a range (called a “range lookup”), and that Dolt can use the indexes to massively speed up join operations.
Dolt currently supports point lookup joins, but not range lookup joins. Thus, it makes sense that we were able to optimize joins that filter on specific values, but not on ranges. Could this be the cause of the slowdown? How could we get more evidence to support this theory?
Fortunately, performance graphs aren’t the only tool we have at our disposal. We can also tell Dolt to DESCRIBE the query, which generates a detailed output of the exact physical plan that the engine plans on using to execute the query.
This is what we get when we ask Dolt to DESCRIBE this query:
+---------------------------------------------------------------------------------------------------+
| plan                                                                                              |
+---------------------------------------------------------------------------------------------------+
| Project                                                                                           |
|  └─ LeftOuterJoin                                                                                 |
|      ├─ Filters                                                                                   |
|      │   ├─ default_rates.created_at <= member_appointments.start_date                            |
|      │   └─ member_appointments.start_date < default_rates.ended_at                               |
|      ├─ LeftOuterLookupJoin                                                                       |
|      │   ├─ Filters                                                                               |
|      │   │   ├─ invoices.payment_type = 'Monthly'                                                 |
|      │   │   ├─ customer_rates.start_date <= member_appointments.start_date                       |
|      │   │   ├─ member_appointments.start_date <= customer_rates.end_date                         |
|      │   │   ├─ invoices.bank = customer_rates.bank                                               |
|      │   │   ├─ employee.certification = customer_rates.certification                             |
|      │   │   ├─ member_appointments.service = customer_rates.service                              |
|      │   │   └─ customer_rates.archived_at IS NULL                                                |
|      │   ├─ LeftOuterLookupJoin                                                                   |
|      │   │   ├─ (member_appointments.employee_email = employees.email)                            |
|      │   │   ├─ LeftOuterLookupJoin                                                               |
|      │   │   │   ├─ (member_appointments.id = invoices.member_appointments_id)                    |
|      │   │   │   ├─ LeftOuterLookupJoin                                                           |
|      │   │   │   │   ├─ (member_appointments.user_id = users.user_id)                             |
|      │   │   │   │   ├─ LeftOuterLookupJoin                                                       |
|      │   │   │   │   │   ├─ (appointments.ma_id = member_appointments.id)                         |
|      │   │   │   │   │   ├─ Table                                                                 |
|      │   │   │   │   │   │   └─ name: appointments                                                |
|      │   │   │   │   │   └─ IndexedTableAccess(member_appointments)                               |
|      │   │   │   │   │       └─ index: [id]                                                       |
|      │   │   │   │   └─ IndexedTableAccess(users)                                                 |
|      │   │   │   │       └─ index: [user_id]                                                      |
|      │   │   │   └─ IndexedTableAccess(invoices)                                                  |
|      │   │   │       └─ index[member_appointments_id]                                             |
|      │   │   └─ IndexedTableAccess(employee)                                                      |
|      │   │       └─ index: [email]                                                                |
|      │   └─ IndexedTableAccess(customer_rates)                                                    |
|      │       └─ index: [service]                                                                  |
|      └─ Table                                                                                     |
|          └─ name: default_rates                                                                   |
+---------------------------------------------------------------------------------------------------+
Every one of the fast joins is implemented as a Lookup Join, while the first slow join is a basic, unoptimzed join. This seems to confirm our suspicions from before: the execution is slow because we’re not using lookups when the filter matches against a range of values. From here, the solution seems obvious: if we add support for range lookups, then we can implement these joins as lookup joins: if we take each range from the right table and use it to perform a range lookup into the left table, then they’ll be just as fast as their neighboring joins. The day is saved.
Could it really be that easy?
It wouldn’t be much of a story if it was.
Chapter 2: The Big Sleep#
Optimizing a database isn’t that different from solving a murder. You make a list of suspects, you study the evidence, and when you find a thread, you pull on it and hope the whole thing comes undone. And so I followed that thread, deep into the shadows. It was a new kind of darkness, a digital noir where corrupted codes and tangled queries danced to their own tune. And something wasn’t adding up.
We quickly realized that it wouldn’t be that easy. And there were two reasons why.
First, these aren’t your standard joins (also called inner joins), these are left joins. Left joins are like inner joins, except every row from the left input is guaranteed to appear in the results, even if it doesn’t match any rows from the right input (every column from the right input will be NULL). And that would be fine… if we were indexing into the right table. But we aren’t. We need to index into the left table. So as we do these range lookups, we need to track which left rows we’ve matched and which ones we haven’t, and then generate extra rows at the end for each one we haven’t. This is doable, but it’s a messy design.
Second, (and more importantly), you can only do a lookup in an index if you have an index. And while the table member_appointments has an index on start_date, the slow join isn’t a join on table member_appointments. It’s a join on the result of another join. (If these were inner joins we could reorder the joins to work around this, but left joins can’t be reordered that way.)
In the end, we had to accept that plan A, the Range Lookup Join, simply wouldn’t work here. The proverbial trail had run cold. We needed a plan B.
And then Max got a brilliant idea. “We don’t need to keep track of all the timestamp ranges, as long as we visit them in the right order. We’d only have to iterate over each table once.”
He laid out an algorithm that looks like this:
- Sort the time ranges by start time.
- Sort the timestamps.
- Whenever we read a new timestamp:
- Check whether the new timestamp “entered” the next time range, and if so, add that time range’s row to an “active ranges” set, then repeat this step with the next range.
- Check whether the new timestamp “exited” any of the “active ranges”, and if so, remove those rows from the “active ranges.”
- Join the new timestamp’s row with every row in the “active ranges”
The key insight was that the “active ranges” could be stored in a priority queue, sorted by end time. This would let us find the time range that would end first in constant time, and remove it and find the next one in log(active ranges) time.
Most physical plans for join operations are taken straight out of textbooks and have accepted names. This would be a new physical plan, optimized for this specific type of query, and it needed a name. I tried to see if there was any prior art for this type of join implementation, but came up empty. So we settled on “Range Heap Join”, because, well, it works by maintaining a heap of ranges.
After implementing this new physical plan (and adding a lot of tests) we had a working prototype. We ran the original query through this new and improved query engine and, to our excitement, saw that we had shaved thirty seconds off the four minute query. An excellent start. And a quick look at the flame graph suggested that we could do more, because only one of the slow joins was being optimized to use our shiny new RangeHeapJoin.
Unfortunately, we couldn’t just apply the same optimization to the other slow join, because it was already being optimized into a Lookup Join (in order to narrow down the search space to only rows that would match the “equals” checks in the join filter.) We considered a more sophisticated algorithm that might help us get the best of both worlds, but we wanted to see if there was any low-hanging fruit first.
One thing that stuck out from the original flame graph was how much time we were spending evaluating the filter conditions for the slow join. And actually, noticing that gave us pause: the whole point of using an optimized join is that you preemptively eliminate any rows that won’t pass the filter conditions. So why were we evaluating these conditions at all? Could we just get rid of them?
We mocked up a change that would remove filter conditions from the plan if we knew that they weren’t necessary because of an optimization. We verified that this change was working properly with additional tests (and even discovered some deficiencies in some of our optimizations that were being masked by the presence of these extra filters). And yet, when we ran the query again, our metrics barely changed. We were still doing all these extra checks even though we knew that they were unnecessary. So why wasn’t the analysis removing them? What were we missing?
Chapter 3: Dial D for DoltHub#
The rain drenched the city streets with a relentless fury, much like the storm brewing inside me. This case had me cornered, every lead a dead-end, every witness a brick wall. I needed something, anything to break this conundrum wide open. As I stared at the empty glass in my hand, I caught a glimmer of light reflecting off a photograph hidden beneath a pile of papers. My fingers trembled as I reached for it, and as I lifted the photo to the dim light, realization struck. The clue I had been desperately seeking was right there, in the photo, staring back at me. It was time to turn this whole damned thing around.
It’s a common trope in detective stories: the big clue that unravels the mystery was under the detective’s nose the whole time. Sometimes an astute reader can even crack the case before the hero. This story is no exception.
Did you catch it? A little detail in the evidence that slipped past us initially.
Here’s the DESCRIBED execution plan again:
+---------------------------------------------------------------------------------------------------+
| plan                                                                                              |
+---------------------------------------------------------------------------------------------------+
| Project                                                                                           |
|  └─ LeftOuterJoin                                                                                 |
|      ├─ Filters                                                                                   |
|      │   ├─ default_rates.created_at <= member_appointments.start_date                            |
|      │   └─ member_appointments.start_date < default_rates.ended_at                               |
|      ├─ LeftOuterLookupJoin                                                                       |
|      │   ├─ Filters                                                                               |
|      │   │   ├─ invoices.payment_type = 'Monthly'                                                 |
|      │   │   ├─ customer_rates.start_date <= member_appointments.start_date                       |
|      │   │   ├─ member_appointments.start_date <= customer_rates.end_date                         |
|      │   │   ├─ invoices.bank = customer_rates.bank                                               |
|      │   │   ├─ employee.certification = customer_rates.certification                             |
|      │   │   ├─ member_appointments.service = customer_rates.service                              |
|      │   │   └─ customer_rates.archived_at IS NULL                                                |
|      │   ├─ LeftOuterLookupJoin                                                                   |
|      │   │   ├─ (member_appointments.employee_email = employees.email)                            |
|      │   │   ├─ LeftOuterLookupJoin                                                               |
|      │   │   │   ├─ (member_appointments.id = invoices.member_appointments_id)                    |
|      │   │   │   ├─ LeftOuterLookupJoin                                                           |
|      │   │   │   │   ├─ (member_appointments.user_id = users.user_id)                             |
|      │   │   │   │   ├─ LeftOuterLookupJoin                                                       |
|      │   │   │   │   │   ├─ (appointments.ma_id = member_appointments.id)                         |
|      │   │   │   │   │   ├─ Table                                                                 |
|      │   │   │   │   │   │   └─ name: appointments                                                |
|      │   │   │   │   │   └─ IndexedTableAccess(member_appointments)                               |
|      │   │   │   │   │       └─ index: [id]                                                       |
|      │   │   │   │   └─ IndexedTableAccess(users)                                                 |
|      │   │   │   │       └─ index: [user_id]                                                      |
|      │   │   │   └─ IndexedTableAccess(invoices)                                                  |
|      │   │   │       └─ index[member_appointments_id]                                             |
|      │   │   └─ IndexedTableAccess(employee)                                                      |
|      │   │       └─ index: [email]                                                                |
|      │   └─ IndexedTableAccess(customer_rates)                                                    |
|      │       └─ index: [service]                                                                  |
|      └─ Table                                                                                     |
|          └─ name: default_rates                                                                   |
+---------------------------------------------------------------------------------------------------+
And here’s only the relevant parts:
|      ├─ LeftOuterLookupJoin                                                                       |
|      │   ├─ Filters                                                                               |
|      │   │   ├─ invoices.payment_type = 'Monthly'                                                 |
|      │   │   ├─ customer_rates.start_date <= member_appointments.start_date                       |
|      │   │   ├─ member_appointments.start_date <= customer_rates.end_date                         |
|      │   │   ├─ invoices.bank = customer_rates.bank                                               |
|      │   │   ├─ employee.certification = customer_rates.certification                             |
|      │   │   ├─ member_appointments.service = customer_rates.service                              |
|      │   │   └─ customer_rates.archived_at IS NULL                                                |

|      │   └─ IndexedTableAccess(customer_rates)                                                    |
|      │       └─ index: [bank]                                                                     |
The join had three different columns we needed to check for equality… but the index only used one.
Inspecting that table, there was an index that used all three:
> show create table customer_rates;
+----------------+---------------------------------------------------------------------------------------------------------------------+
| Table          | Create Table                                                                                                        |
+----------------+---------------------------------------------------------------------------------------------------------------------+
| customer_rates | CREATE TABLE `customer_rates` (                                                                                     |
|                |   `id` int NOT NULL AUTO_INCREMENT,                                                                                 |
|                |   `bank` varchar(255) NOT NULL,                                                                                     |
|                |   `start_date` date NOT NULL,                                                                                       |
|                |   `end_date` date NOT NULL,                                                                                         |
|                |   `service` varchar(255) COLLATE utf8mb4_0900_ai_ci DEFAULT NULL,                                                   |
|                |   `certification` varchar(32) COLLATE utf8mb4_0900_ai_ci NOT NULL,                                                  |
|                |   `rate` int NOT NULL,                                                                                              |
|                |   `archived_at` timestamp(6) DEFAULT NULL,                                                                          |
|                |   PRIMARY KEY (`id`),                                                                                               |
|                |   KEY `bank_id` (`bank`),                                                                                           |
|                |   UNIQUE KEY `rate_for_time_range` (`bank`,`certification`,`service`,`start_date`,`end_date`,`archived_at`),        |
|                |   KEY `start_date` (`start_date`,`end_date`)                                                                        |
|                | )                                                                                                                   |
+----------------+---------------------------------------------------------------------------------------------------------------------+
We see that this table has four different indexes (the output above calls them KEYS). One of them, rate_for_time_range, starts with three columns that we want to filter by. (The fact that we wouldn’t use the remaining columns is okay. Imagine a table of contents that divides chapters into sections: you can still use it to look up the start of a chapter.) Using a good index is important because it massively reduces the number of rows we need to evaluate.
But the chosen plan wasn’t using that index. It was using the index bank_id, which only indexes one of those three columns: this makes it a strictly worse choice for our purposes. So why was it being chosen? Once we knew where to look, we were able to quickly identify what was happening:
When a table has multiple indexes, the engine needs to choose the best one to use. We had coded a special case into the analysis, where if an index was fully utilized (every one of the index’s columns was part of the lookup), we gave that index a bump in priority.
Now, if you think about it, it makes sense that you might want to do that. Imagine you had a database of historic buildings with their names and addresses, and you had two different indexes into that table:
create table buildings (name string,
city string,
street_name string,
street_number number
index idx_name (name),
index idx_address (city, street_name, street_number)
)
Now imagine you wanted to look up a building and all you had was the building name, the street name, and the city, but not the street number. What’s the better index to use? Obviously, the name index is better because it’s a lot more likely to uniquely identify the building. If you use the address index without a street number, you’ll have to go through every building on that street until you find the right one. So using that logic, it made sense to prioritize an index that you could fully take advantage of: a partial index is much more likely to give multiple results, while a full index is much more likely to be unique.
Except we recently added a separate optimization that helps us detect when an index uniquely identifies table rows, and both candidate indexes here failed that check. So when choosing between two indexes that can’t uniquely identify a row, did it still make sense to favor the one that’s “fully” used? We decided it wasn’t. Removing that special case improved some of our test metrics… and more importantly, removed nearly all of the time we spent evaluating the join conditions. That part of the flame graph almost completely disappeared. See?
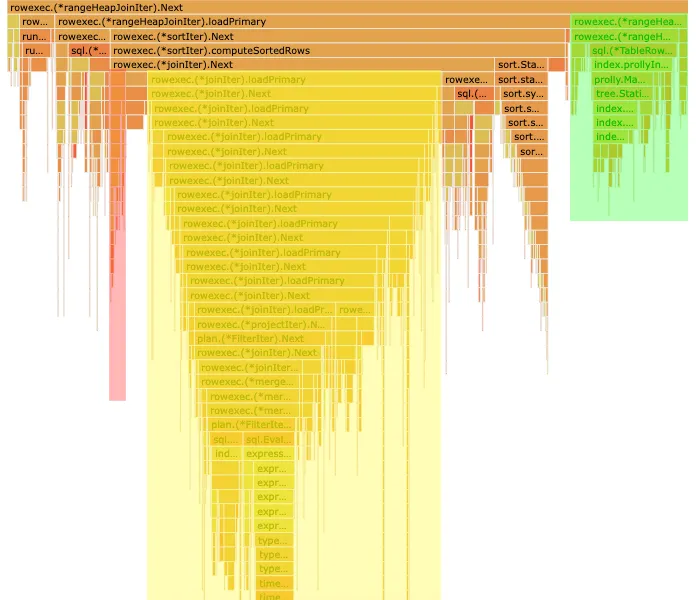
Notice how the yellow portion, representing how much time the engine spends on the twelve fast joins, is now a substantially larger portion of the runtime. The blue portion (the time spent loading records from the default_rates table) has disappeared entirely, since we now only have to read the table once.
This was an even bigger win than what we got from implementing RangeHeapJoin: our shiny new join plan may have saved thirty seconds on a four minute query… this saved eighty seconds.
In the end, it wasn’t our fancy new join implementation that gave us the biggest win: it was a single line change in our coster, based on information that was in front of our eyes the whole time, hiding in plain sight.
Funny how that happens.
The query now runs at just over two minutes… within spitting distance of MySQL’s performance on the same hardware. And there’s other optimizations we could do that might even let us cross that line, like writing a join plan that leverages both an index lookup and a range heap and get the best of both worlds.
But that’s a story for another time.
(Special thanks to ChatGPT for assisting with the heavy-handed noir portions of this blog post. If you didn’t like it, join our Discord and complain about it to me directly!)