
I’m new to Dolt, both as a user and as an employee. Since I’m new here, I suppose I should introduce myself. I’m Neil 👋. You can look at my history on LinkedIn, but what matters is that I’d describe myself as developer obsessed. I’ve spent most of my career trying to make developer tooling better, and I know an unreasonable amount about Git. Dolt’s mission to bring version controlled databases to developers aligns with my Git experience, but SQL is a different beast altogether. Debugging Dolt’s SQL behavior proved to be a great way for me to jump in and learn about how Dolt works. I thought I’d share what I learned. If you get inspired, jump on one of our SQL issues. There is no overlap between issues labeled sql and good-first-issue, so now you’re playing on hard mode!
First, as a group, most of us at Dolt use an IDE - specifically GoLand. I’m a die hard unix terminal user and fan of Vim, but I’m going to concede that debugging in an IDE is just better all around. I suggest you find an IDE you like (then install its Vim plugin!). VSCode is pretty solid. You could use this post to help you dive into Dolt with a terminal debugger. YOLO, GLHF! Second, I’m not going to cover the basics of git, pull requests, and how you contribute code to Dolt. That’s well covered in a blog post from the past. This post is possibly a little more advanced as I expect you to be able to read a git diff and apply it in your workspace.
Run a New Test In Your IDE#
Clone the go-mysql-server repository. Open it with your IDE of choice, and make your way to the enginetest/memory_engine_test.go file. That file is where we start our SQL testing, and there is a function, TestSingleScript(), which serves as an entry point to start a test.
These scripts all follow the pattern of some setup followed by assertions. There are many examples of such scripts in our code base, and one of the advantages of starting with debugging a problem here is that we can easily copy and paste this code into an existing test file to ensure we don’t regress in the future. Take a look at these for ideas on how you could write your own test. Also worth pointing out that we have a similar file in the dolt repository. If you are trying to reproduce a bug you find in Dolt, and you can’t do it in memory_engine_test.go, you should try it in the dolt repository. For this post, you don’t need to use the dolt repository at all.
Go ahead and overwrite whatever is in the []queries.ScriptTest in the TestSingleScript function with the following:
	// t.Skip()
	var scripts = []queries.ScriptTest{
		{
			Name: "primes joined with fibonaccis",
			SetUpScript: []string{
				`CREATE TABLE prime (id int PRIMARY KEY AUTO_INCREMENT, value int)`,
				`INSERT INTO prime (value) VALUES (2), (3), (5), (7), (11), (13), (17), (19), (23), (29), (31), (37), (41),
                                              (43), (47), (53), (59), (61), (67), (71), (73), (79), (83), (89), (97),
                                              (101), (103), (107), (109), (113), (127), (131), (137), (139), (149),
                                              (151), (157), (163), (167), (173), (179), (181), (191), (193), (197), (199),
                                              (211), (223), (227), (229), (233), (239), (241);`,
				`CREATE TABLE fibonacci (id int PRIMARY KEY AUTO_INCREMENT, value int)`,
				`INSERT INTO fibonacci (value) VALUES (0), (1), (1), (2), (3), (5), (8), (13), (21), (34), (55), (89), (144), (233)`,
			},
			Assertions: []queries.ScriptTestAssertion{
				{
					Query: `SELECT prime.id,fibonacci.id,fibonacci.value FROM fibonacci INNER JOIN prime ON fibonacci.value = prime.value AND fibonacci.id < prime.id LIMIT 1`,
					Expected: []sql.Row{
						{24, 12, 89},
					},
				},
			},
		},
	}
This test above creates two tables, prime and fibonacci, which have sequence numbers for primary keys, and a value column for each. We also populate them with appropriate values for each number series up to values less than 250. We have one assertion which verifies that an inner join with a limit produces the result we expect.
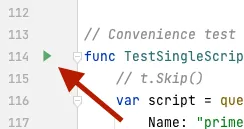
In any Go capable IDE, you should be able to run the TestSingleScript function pretty easily. In GoLand and VSCode, there is a little green “play” button to the left of the function. Smash that thing! After the code compiles and runs, you should see output in your console which states that the test ran and passed. If you don’t see that, you won’t be able to debug anything, so don’t blow by this step.
The test harness enables verbose logs. Broadly speaking, there are INFO messages which tell you that some kind of analysis will be done, hierarchical trees, and deltas to those trees. In the thousands of lines of output, you should have a snippet which looks like this:
QueryProcess
 └─ Limit(1)
     └─ Project
         ├─ columns: [prime.id:2!null, fibonacci.id:0!null, fibonacci.value:1]
         └─ InnerJoin
             ├─ AND
             │   ├─ Eq
             │   │   ├─ fibonacci.value:1
             │   │   └─ prime.value:3
             │   └─ LessThan
             │       ├─ fibonacci.id:0!null
             │       └─ prime.id:2!null
             ├─ Table
             │   ├─ name: fibonacci
             │   └─ columns: [id value]
             └─ Table
                 ├─ name: prime
                 └─ columns: [id value]
This is the execution plan for the query in the assertion of the test. (Exercise for the reader: run this with dolt sql and EXPLAIN the query. The output will look a lot like that!) For anyone familiar with compilers, you’ll recognize this as an Abstract Syntax Tree (AST). These execution plans are complex beasts (here too). Queries are parsed into Node trees, then analyzer rules process these execution plans until they stabilize into an optimal query.
Break the Analyzer#
The Node interface for the AST is implemented in core.go, and there are many implementations to make this all work. Let’s break the behavior of the And node, and see what happens.
diff --git sql/expression/logic.go sql/expression/logic.go
index b01e386e..f6ce289a 100644
--- sql/expression/logic.go
+++ sql/expression/logic.go
@@ -116,7 +116,7 @@ func (a *And) WithChildren(children ...sql.Expression) (sql.Expression, error) {
        if len(children) != 2 {
                return nil, sql.ErrInvalidChildrenNumber.New(a, len(children), 2)
        }
-       return NewAnd(children[0], children[1]), nil
+       return NewAnd(children[0], children[0]), nil
 }
I know it’s impossible to un-see that, but imagine you don’t know where the bug is. Run your test again, and it should fail (if it doesn’t then there is definitely something wrong in your set up.) A careful read of your logs, and you’ll find the following:
INFO: default-rules/0/resolveColumns: --- Prev
+++ Next
@@ -2,3 +2,3 @@
  └─ Project
-     ├─ columns: [prime.id, fibonacci.id, fibonacci.value]
+     ├─ columns: [prime.id:2!null, fibonacci.id:0!null, fibonacci.value:1]
      └─ InnerJoin
@@ -6,7 +6,7 @@
          │   ├─ Eq
-         │   │   ├─ fibonacci.value
-         │   │   └─ prime.value
-         │   └─ LessThan
-         │       ├─ fibonacci.id
-         │       └─ prime.id
+         │   │   ├─ fibonacci.value:1
+         │   │   └─ prime.value:3
+         │   └─ Eq
+         │       ├─ fibonacci.value:1
+         │       └─ prime.value:3
          ├─ Table
This is what I see when I look at the two objects in GoLand. You can see that the filter expression in the query, which is fibonacci.value = prime.value AND fibonacci.id < prime.id has been modified incorrectly and now is effectively fibonacci.value = prime.value AND fibonacci.value == prime.value
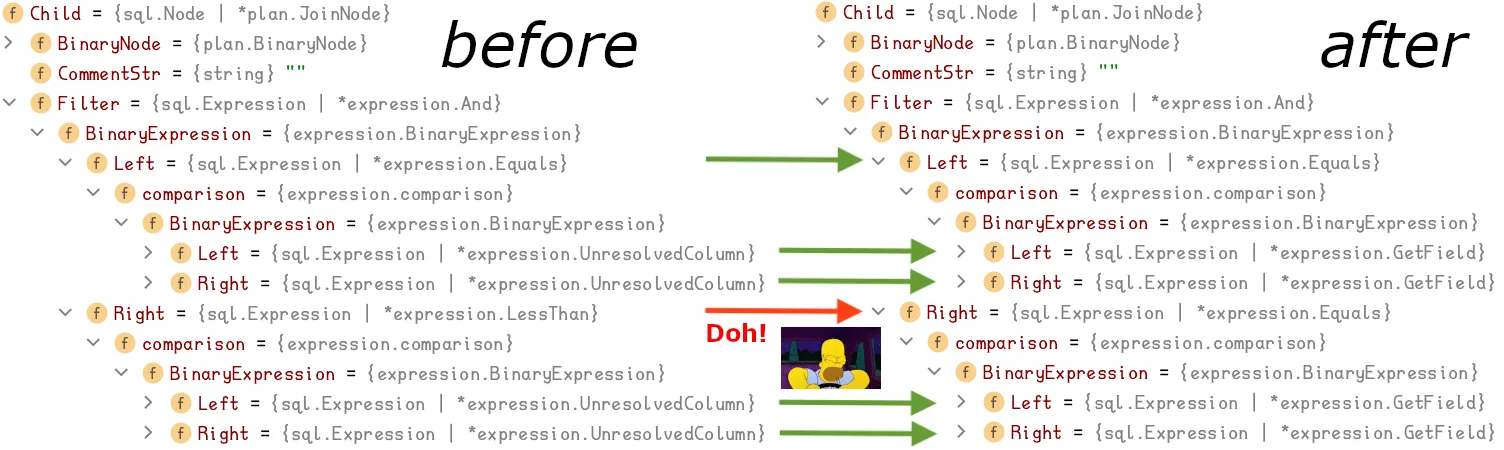
Remember before when I mentioned that we go over the AST several times with an analyzer to create the execution plan for the query? What you are witnessing in the log above is the resolveColumns analyzer rule making a change to the AST. On the “before” side of the transaction, the And filters had UnresolvedColumn values in them, which means that we knew the column name, but we didn’t know where in the row data it was found. The resolveColumn analyzer rule ran and determined it needed to make its contribution of converting the objects to GetField nodes, and in the process it broke the node above it. The LessThan became an Equals. Also worth pointing out that the values converted for the two lower arrows look correct from a type perspective, but are actually wrong. You can’t tell in the picture, but you can tell in the logs. This is all to say, given that we run at a minimum of 112 rule executions, a lot can go wrong!
Analyzer Rule Evaluation#
Those 112 rule executions are all listed sql/analyzer/rules.go. The input and output of each analyzer rule is the AST for the transaction, and some of them are run multiple times until the input and outputs stabilize and no longer change.
Due to the code change we made, we’ve introduced an analyzer bug which changes the execution plan from a LessThan expression to an Eq expression. This will obviously produce incorrect results. How could you debug this?
Three places to start from:
-
engine.go:QueryNodeWithBindings()is the first place to start if you want to see the whole analyzer workflow in action. You’ll need to drill down from there into the analyzer execution. One thing to note is that you may want to drop code snippets in here to enable you to conditionally break for some queries, and not others. Putting comments in your queries can help for this. For example, if you put/*DBG*/in the test query, you can use thequeryvariable inQueryNodeWithBindingswith a small code snippet:if strings.Contains(query, "/*DBG*/") { _ = query }Worth calling out - I’ve learned to not use conditional breakpoint features of IDEs unless it’s a trivial condition. They work in some cases and not others
One thing to point out about
QueryNodeWithBindingsis that if you are several layers deep in the stack, it can be helpful to look at the stack frame to ensure that you are looking at the right query. GoLand has a powerful feature which will enable specific breakpoints IFF another breakpoint has been hit. Using this feature allows us to debug specific nodes quickly without needing to manually skip many breakpoints before we get to our problematic query. -
Dropping a breakpoint in the
evalOnce()method ofsql/analyzer/batch.gowill help you to determine when the AST is being updated. The logging output does a pretty good job of printing what has changed from one analyzer to the next, but it’s not perfect. Looking at the structure instance in the debugger is sometimes your only option. Therule.Apply()method does the work.previs the input AST,nextis the output AST, andsameis a boolean to indicate if a change happened. In fact, almost all of the logging information you see is fromsql/analyzer/batch.go, so you know for sure it’s a good place to drop a breakpoint to start your exploration.
		a.Log("Evaluating rule %s", rule.Id)
		a.PushDebugContext(rule.Id.String())
		next, same, err = rule.Apply(ctx, a, prev, scope, sel)
		allSame = same && allSame
		if next != nil && !same {
			a.LogNode(next)
			// We should only do this if the result has changed, but some rules currently misbehave and falsely report nothing
			// changed
			a.LogDiff(prev, next)
}- Analyzer rule functions are all listed in
sql/analyzer/rules.go. You may be able to determine which rule is causing a problem from the logs, then just start in the rule itself. Set your breakpoints there and walk the code.
Tests for the Win#
The Analyzer is a complex state machine which we’ve put a lot of work into. Having tests which we can re-run for every release is critical to ensuring that we don’t regress. Dropping code into the TestSingleScript method is a great way to consistently reproduce a problem. If you get that far but don’t fix the problem, contribute by sending us a pull request with your new test. We’ll definitely use it, and you’ll get to say you contributed to Dolt! As always we are on Discord to answer any questions and help you debug!