
A customer wanted to use Apache Superset to visualize Dolt databases. This customer runs DoltLab and intends to version hundreds of databases there. He wants a subset of those databases available to Superset for visualization.
Dolt provides some powerful versioning features to Superset charts and dashboards. Dolt “just works” with Superset using the MySQL connector so it’s really easy to get started.
This blog will show you:
- How to set up Superset and Dolt to work together.
- How to use the version control features of Dolt with Superset.
Why Dolt + Superset?#
Dolt adds a versioning layer to your data or metrics. As a data scientist or analyst, you inspect a dashboard or table and something looks fishy. Was this number always 10? I thought I saw 8 the last time I ran this report? When did that change? Dolt allows your data scientists and data analysts to answer audit questions on your data and metrics by providing an audit log of every cell in the database: who changed what, when? Data versioning will improve the efficiency of your data team.
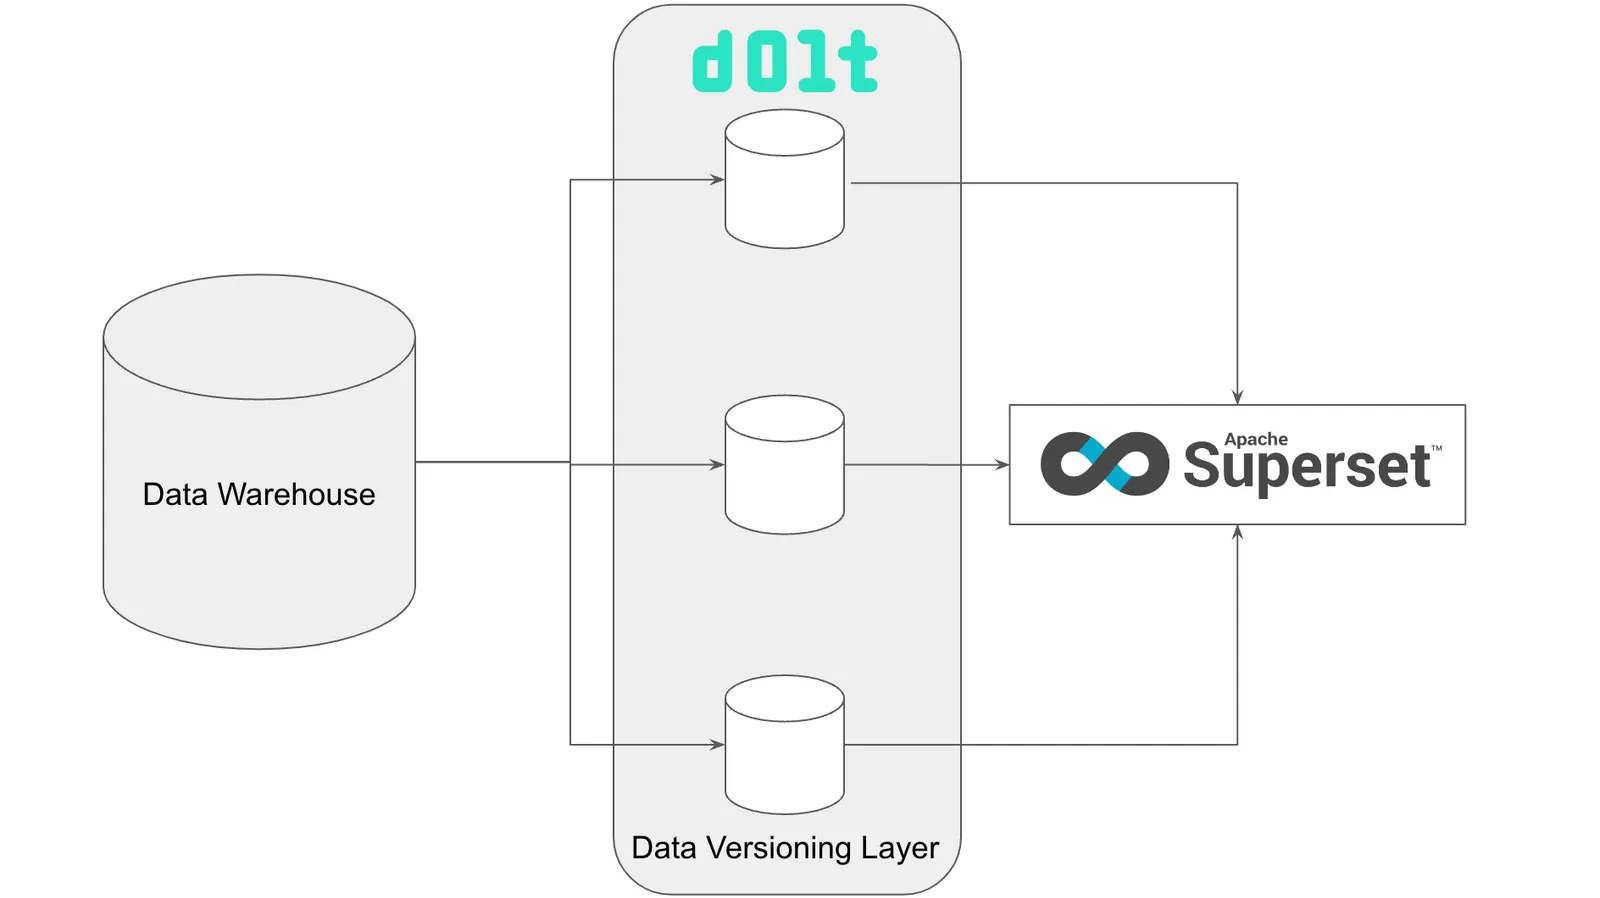
In this scenario, Dolt would version the tables output by your data warehouse jobs, think nightly metrics runs. This is a natural place to hook versioned Dolt databases up to your dashboarding infrastructure, like Superset.
In addition to auditing metrics, Dolt makes your metrics layer safe for writes. Want to preserve a forecasting model but not have it affect production data? Do it on a branch. Branches can greatly improve data team collaboration. Data analyses that currently happen in spreadsheets or notebooks can be shared and collaborated on more easily.
Installing Superset#
Superset was easy to install using Docker. I had some trouble getting it installed from scratch on my M1 Mac. The from scratch failed because it could not build an outdated version of Pandas. It seems like Pandas fixed the issue in the latest release but Superset has their Pandas version pinned. Anyway, I recommend going with the Docker version.
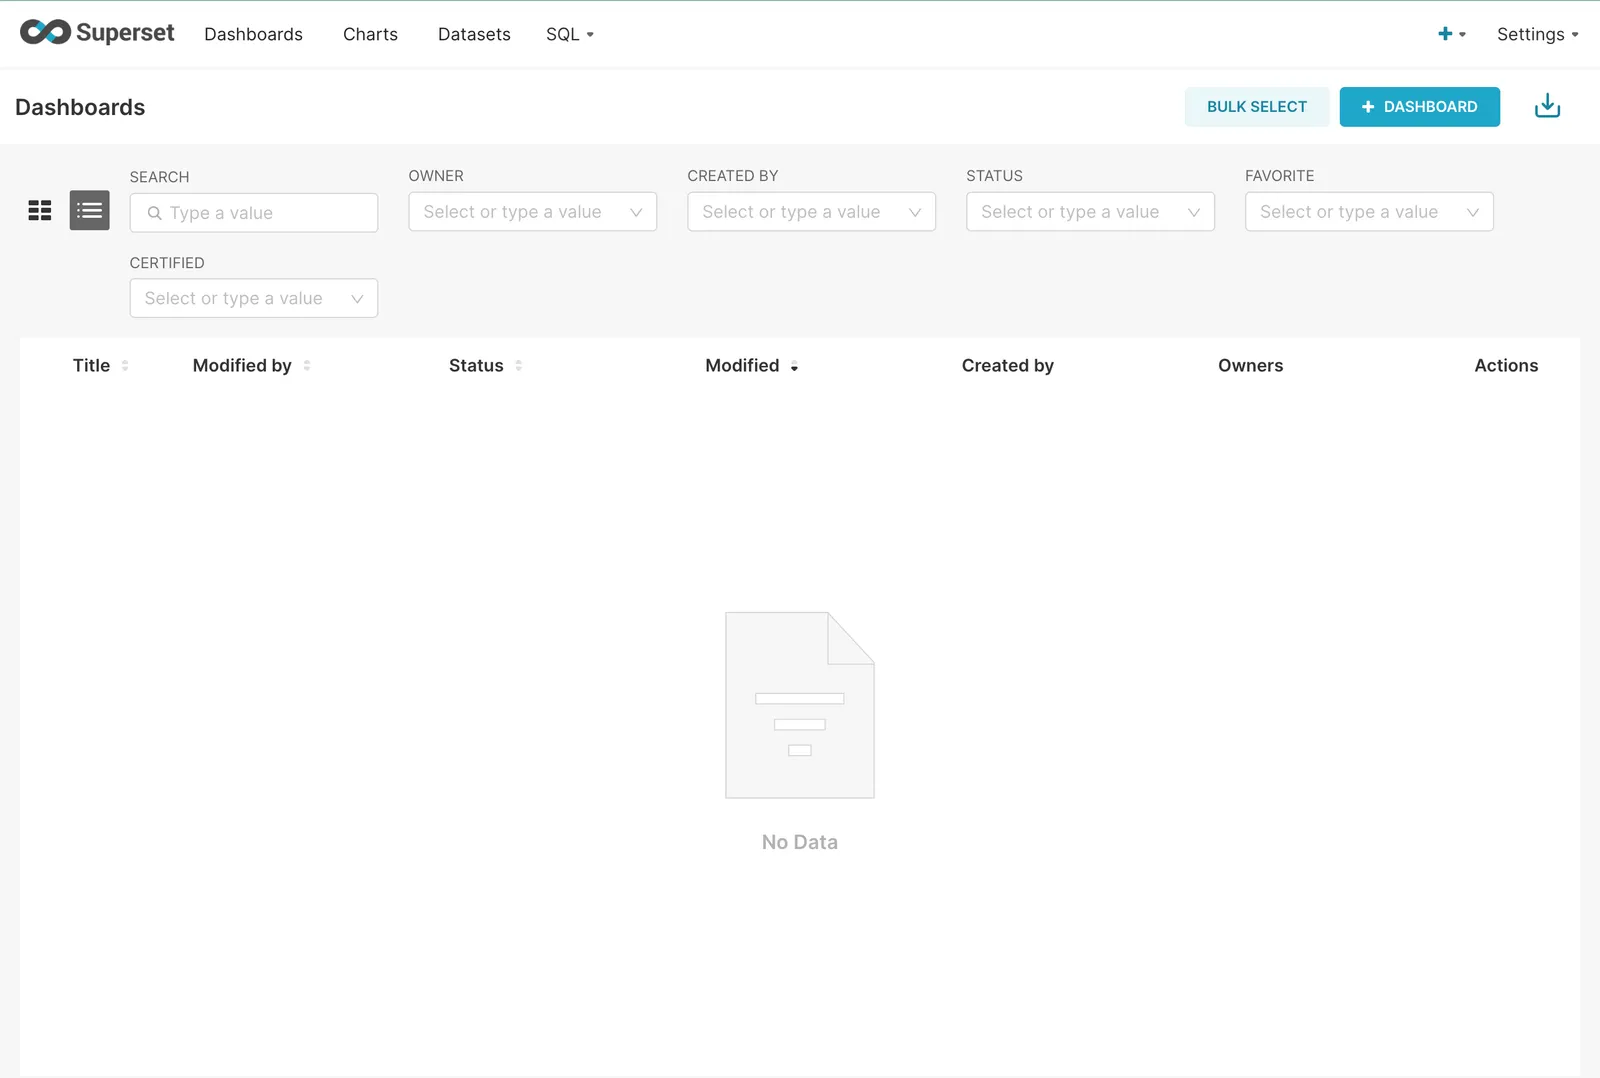
The Docker install steps are really straightforward. I hit the http://localhost:8080, note the http, and I was greeted with a log in screen. I logged in with user admin and password admin. The Superset UI was really easy to understand. The version I installed had a number of demo dashboards, charts, and datasets. Once I got a feel for the tool, I deleted all the demo stuff.
Now, I have a clean Superset.
Connecting to Dolt#
Because Superset is a dashboarding tool, I made a simple_example database with some synthetic Daily Active User and Monthly Active user metrics. I’ll use it when showing off branches later in this article.
I also grabbed two larger databases from DoltHub using dolt clone to see how Superset does with larger databases: museum-collections and us-housing-prices-v2. I placed these all in the same directory on my laptop. Dolt makes it really easy to copy and sync databases.
$ ls -1 /Users/timsehn/dolthub/superset-demo-dbs
museum-collections
simple_example
us-housing-prices-v2
In that directory, I run dolt-sql-server to start a MySQL compatible Dolt server on port 3306. Connecting to this server will allow me to access those three databases. See our Version Controlled Database Getting Started if you need help with this.
Now, I head over to Superset and go to Settings > Database Connections. I select MySQL as the connection type. Because Superset is running in Docker on Mac, you need to set the Dolt Host to host.docker.internal to get access to the actual localhost. Pick one of the databases you want to access, I picked simple_example but you’ll have access to all of them using the same Superset connection. By default in Dolt, the username is root with no password.
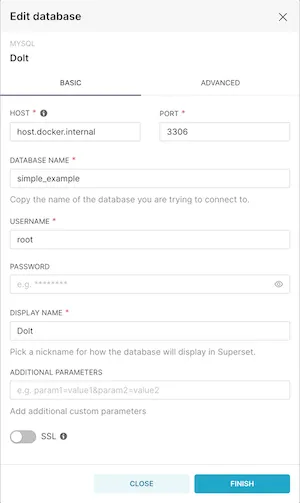
I also clicked Advanced > SQL Lab and “Allow DML” so I get access to Dolt’s stored procedures, like call dolt_checkout() to switch branches.
Now, after clicking FINISH you should be connected to Dolt!
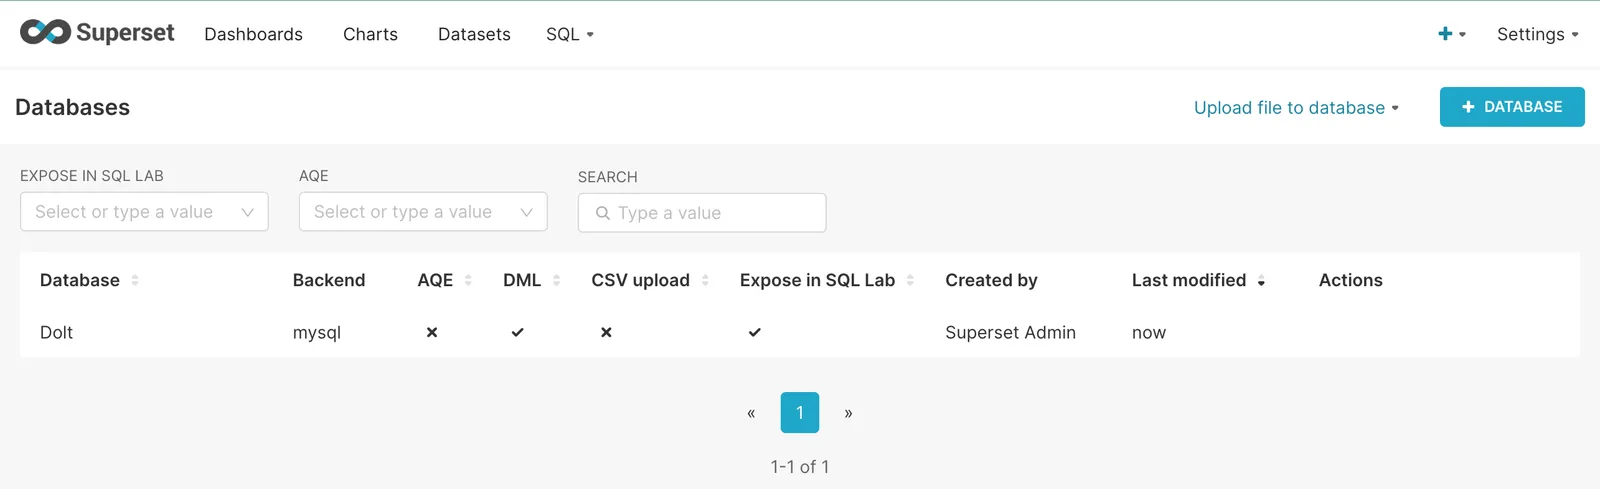
Heading over to the SQL Lab can confirm.
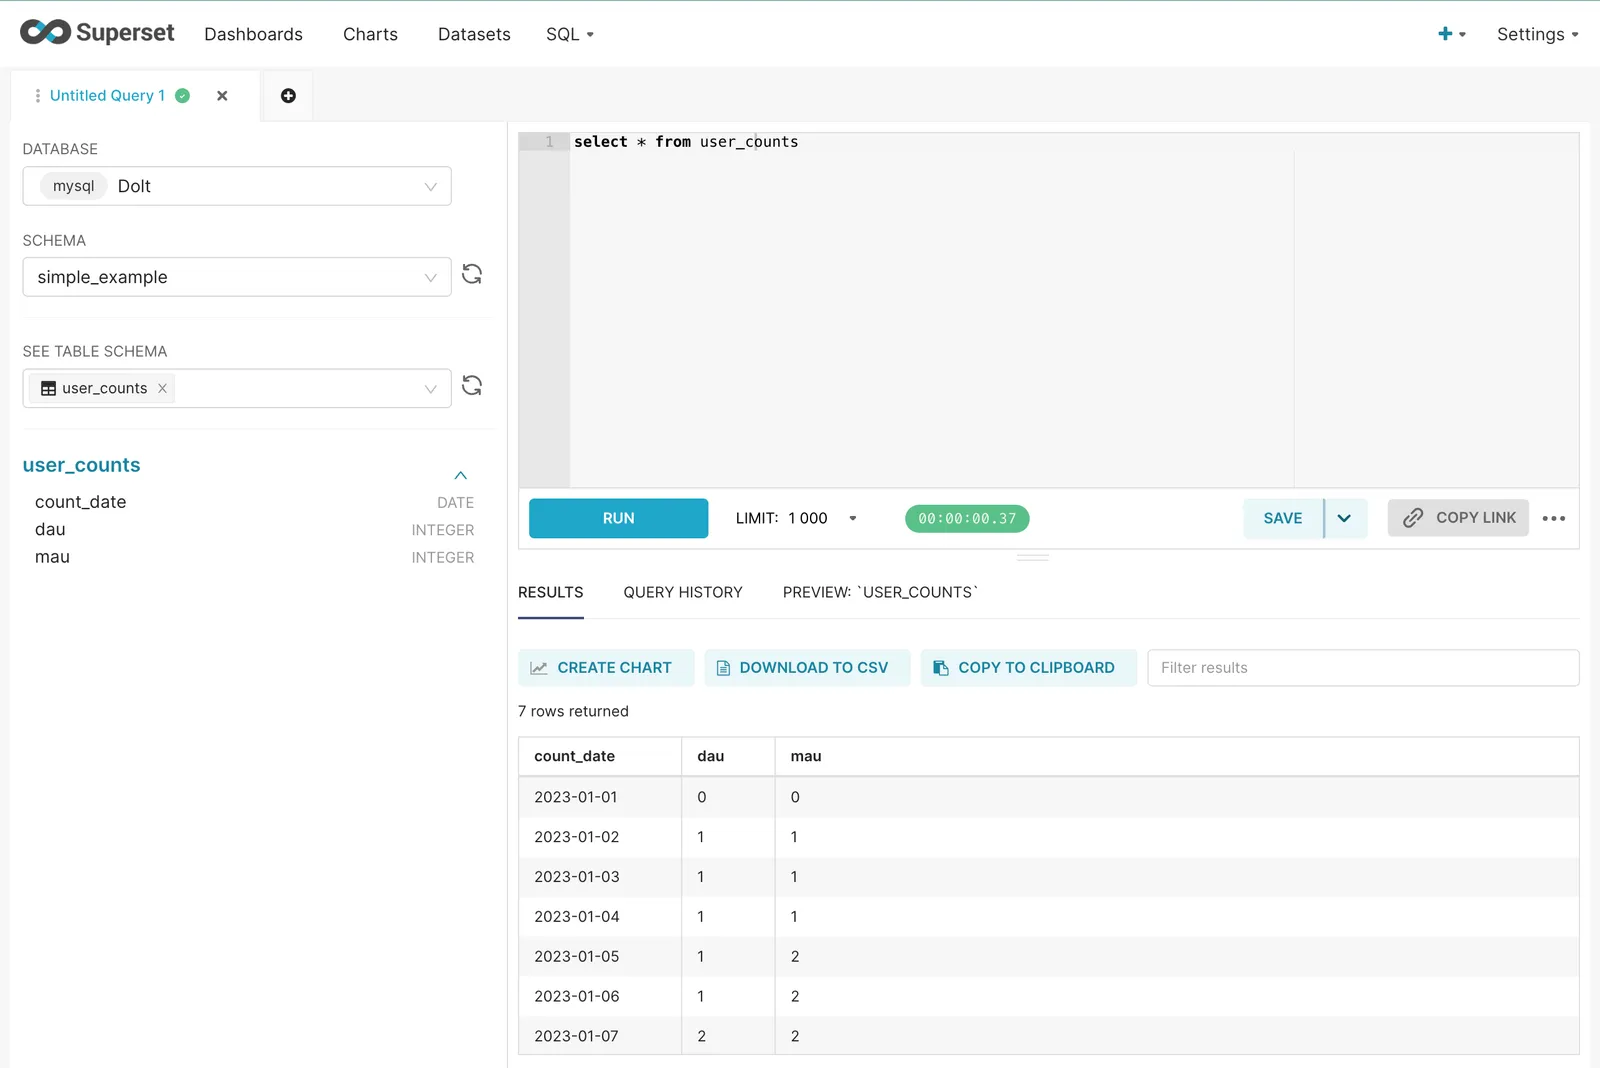
We are all good. I can see the user_counts table in the simple_example database.
Using the Superset SQL Lab#
We have a simple query working. Let’s try some more complex ones in Superset’s SQL Lab by exploring the us-housing-prices-v2 database. This is a database of over 100M housing sales collected using one of our data bounties. We’re going to see what some of the biggest prices paid in one of our Santa Monica, zip codes are. You know, Selling Sunset style. If only we had the agent in the database.

At first I tried running a simple sort query but got some strange results:
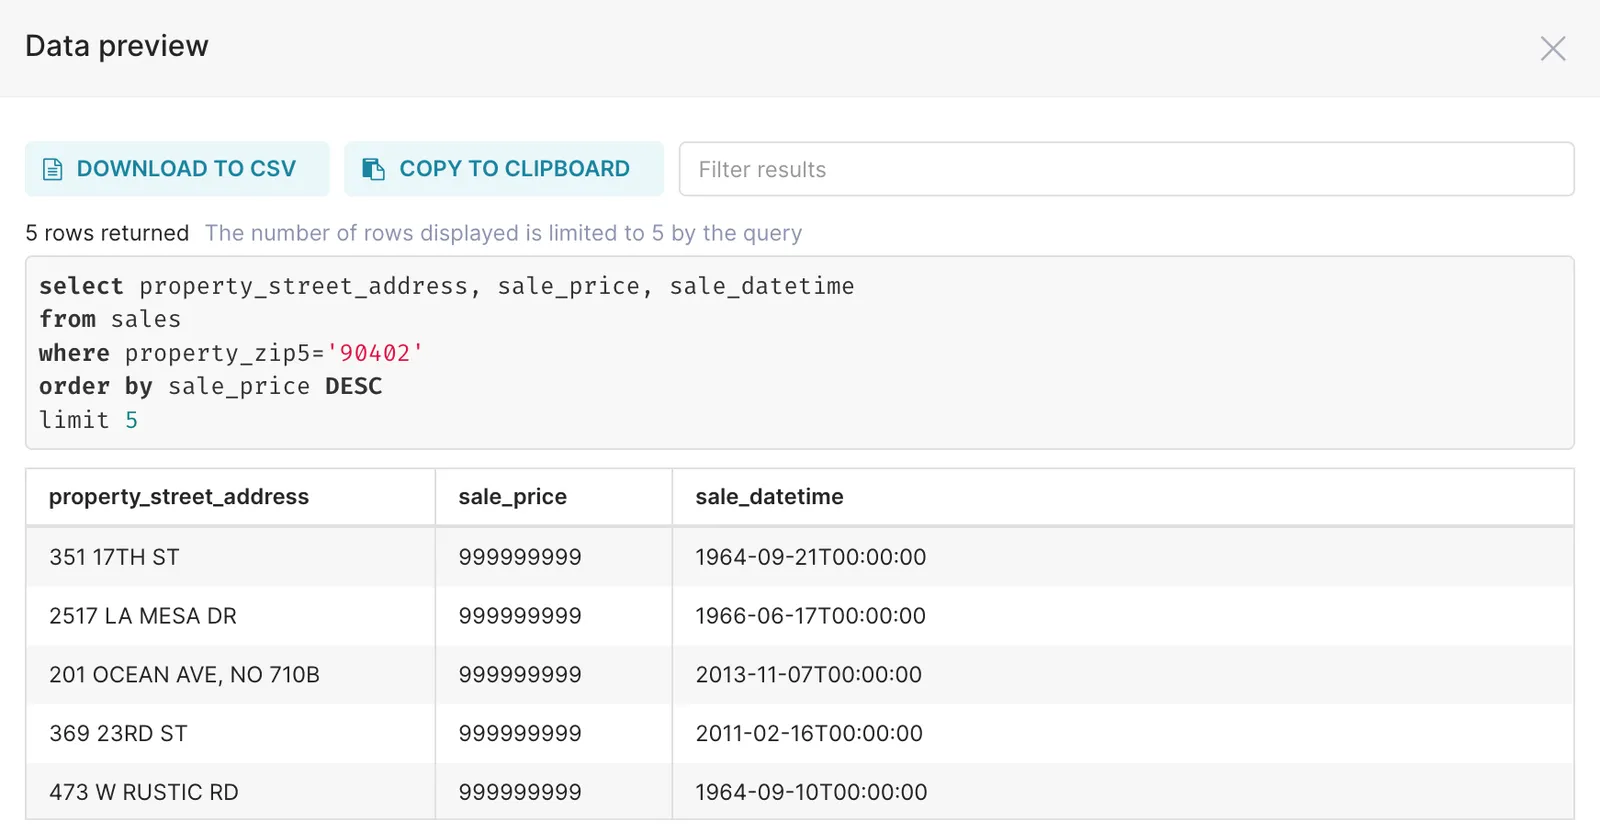
It’s very unlikely that a house sold for $1B - $1 in 1964. Let’s limit the results to sales less than $100M so we can filter for more likely to be real sales.
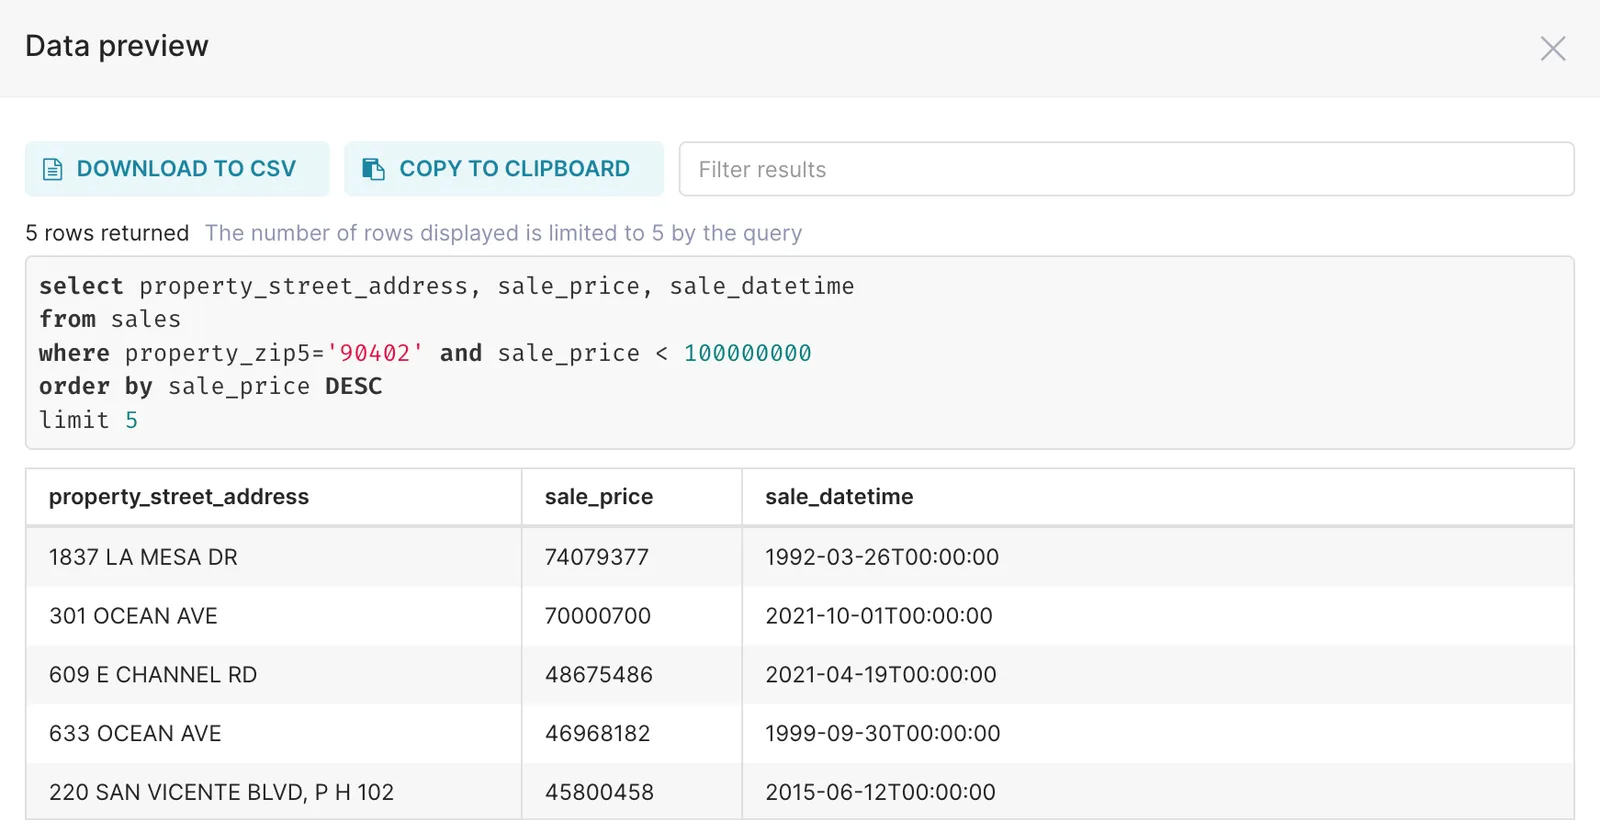
As crazy as it seems, those could be real sales but we’ve noticed a lot of junk prices in this data. It appears Sunset is expensive.
Anyway, that’s kind of beside the point of this blog. We’ve written about housing prices elsewhere. Dolt gives you the full power of a modern SQL database. Superset gives you a convenient web-based SQL Workbench to explore your data. Feel free to use Superset to explore some of our free and open bounty databases.
Creating a Dataset, Chart, and Dashboard#
Now we get to some of the cool visualization and dashboarding features of Superset.
In museum-collections database, we paid bounty hunters to scrape museum websites from around the world and put their collections in this database. Let’s say we want to visualize the geographic coverage of objects in this database. In Superset, this is pretty easy.
I first navigate to the Datasets tab and add a new dataset. I select the Dolt database, the museum_collections schema, and the objects table and click ADD DATASET AND CREATE CHART. I’m greeted with a number of chart options and select the map one.
I used the institution_country as the “Country Column”, changed “Country Field Type” to “Full name”, and finally made the metrics a count of the object_number column. I clicked UPDATE CHART and Voila!
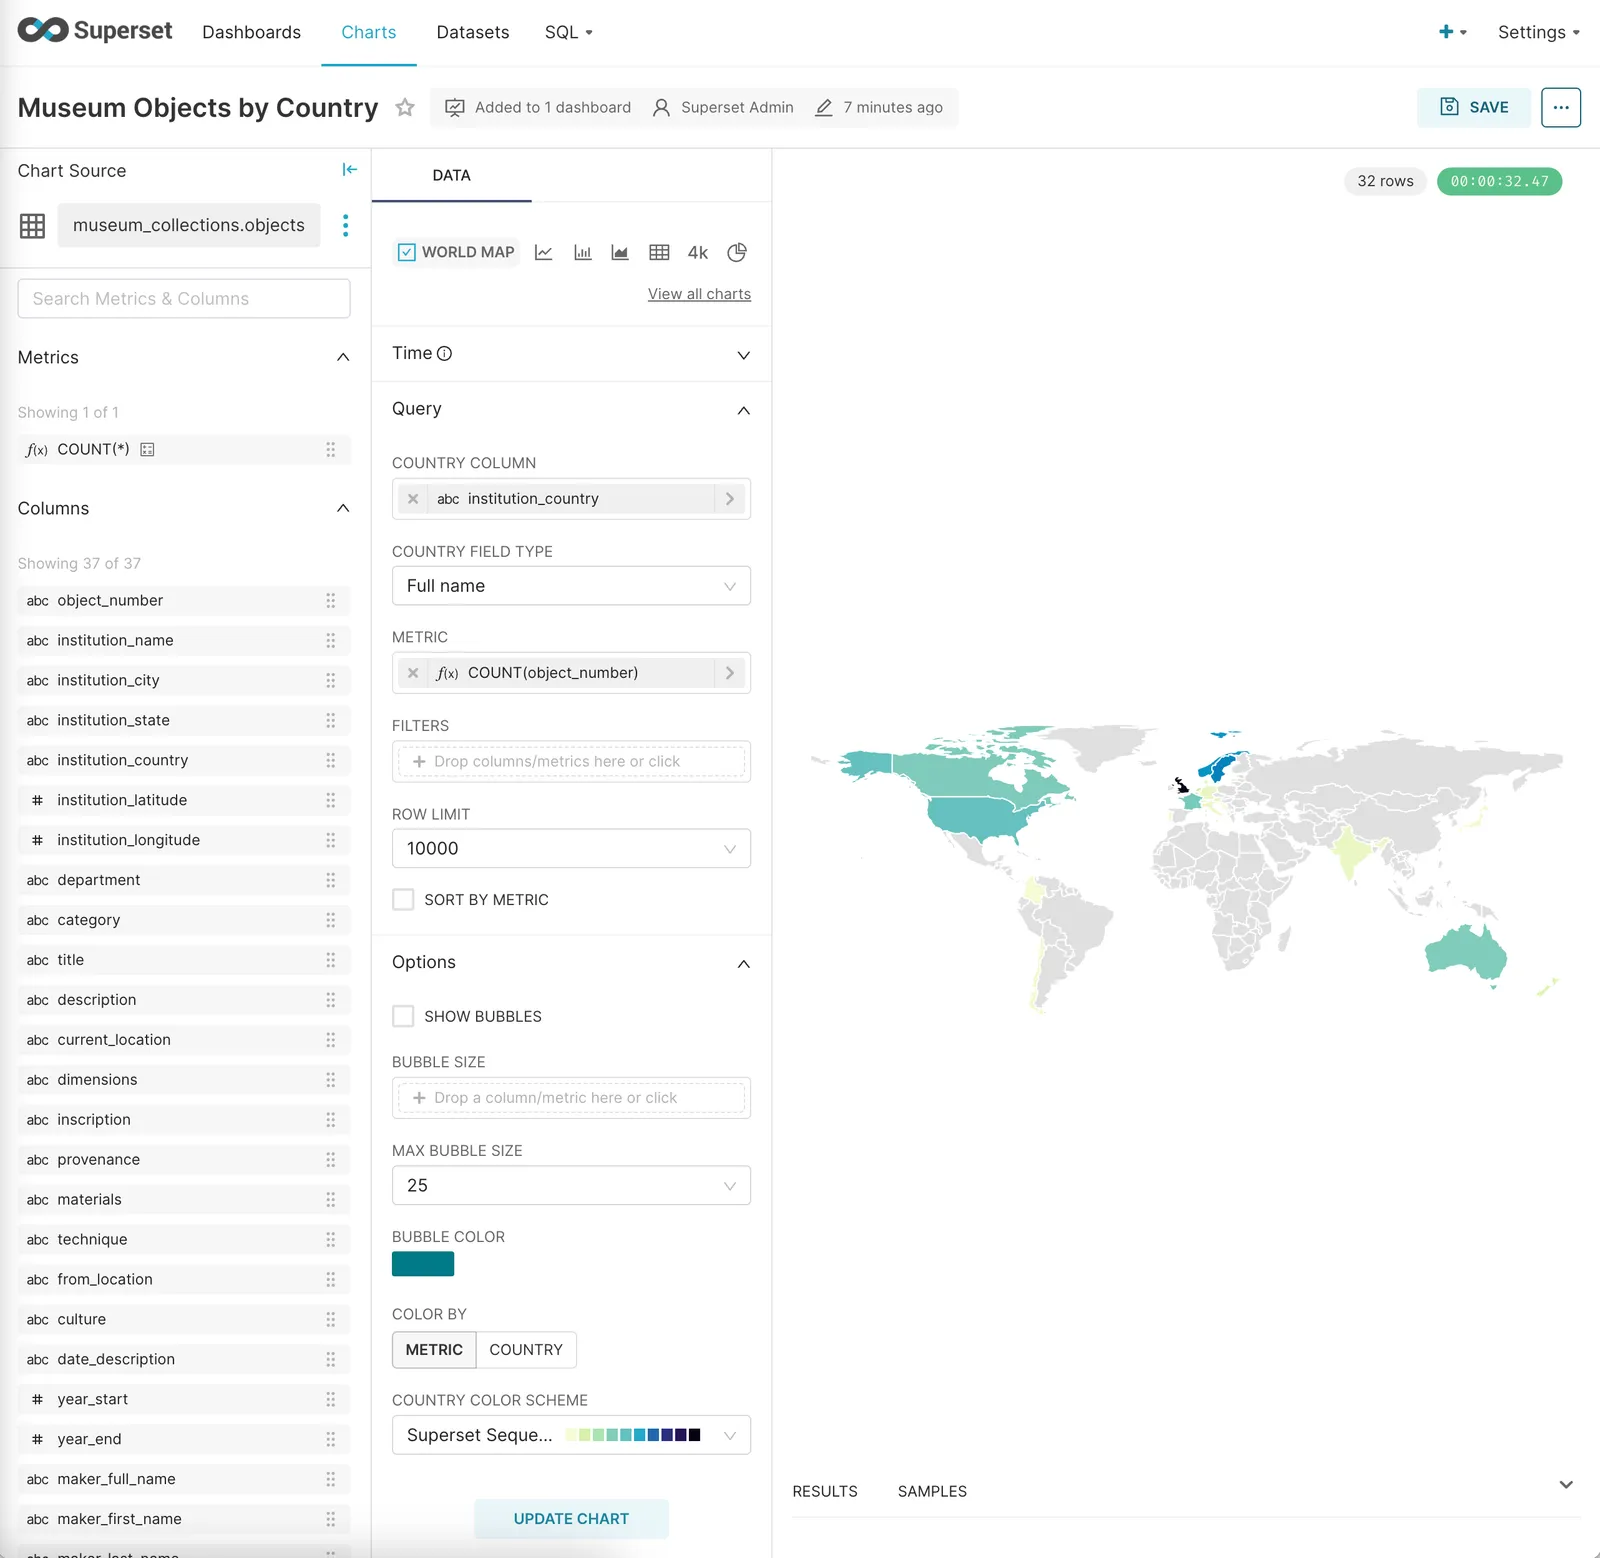
I can then Save the chart and add it to a Dashboard. Superset makes this all quite simple and easy. I have to say, I found the Superset interface pretty intuitive and easy to use. I recommend it as a visualization tool for your data teams.
Viewing historical data using AS OF queries#
Now on to the Dolt features. It was pretty easy to get Dolt features working in Superset SQL Lab. Superset allows you to run raw SQL queries so doing a call dolt_checkout() on a branch or select * from table as of commit worked fine.
For this example, I went in the US Housing Prices commit log and found a commit before the last bounty started. I then compared that to the HEAD (or latest) commit.
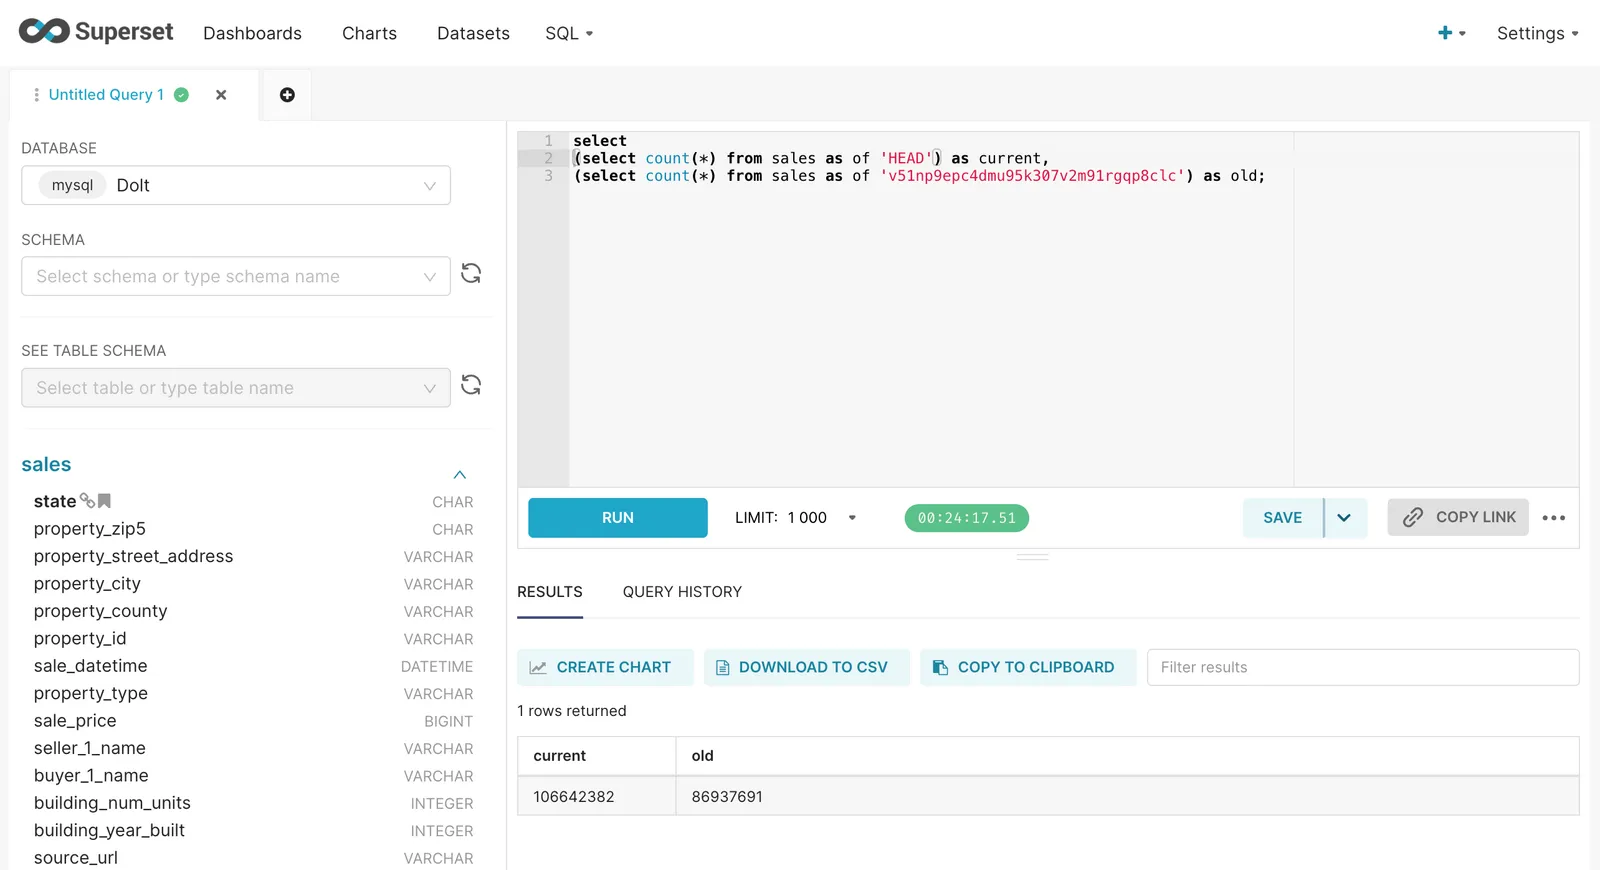
It looks like we added about 20M sales in the last US Housing Prices bounty.
Using Branches in Superset#
Now, an example of how you might use branches in Superset. Let’s go back to our simple_example database that has fake daily active user and monthly active user metrics. Let’s imagine your dashboard looks like this.
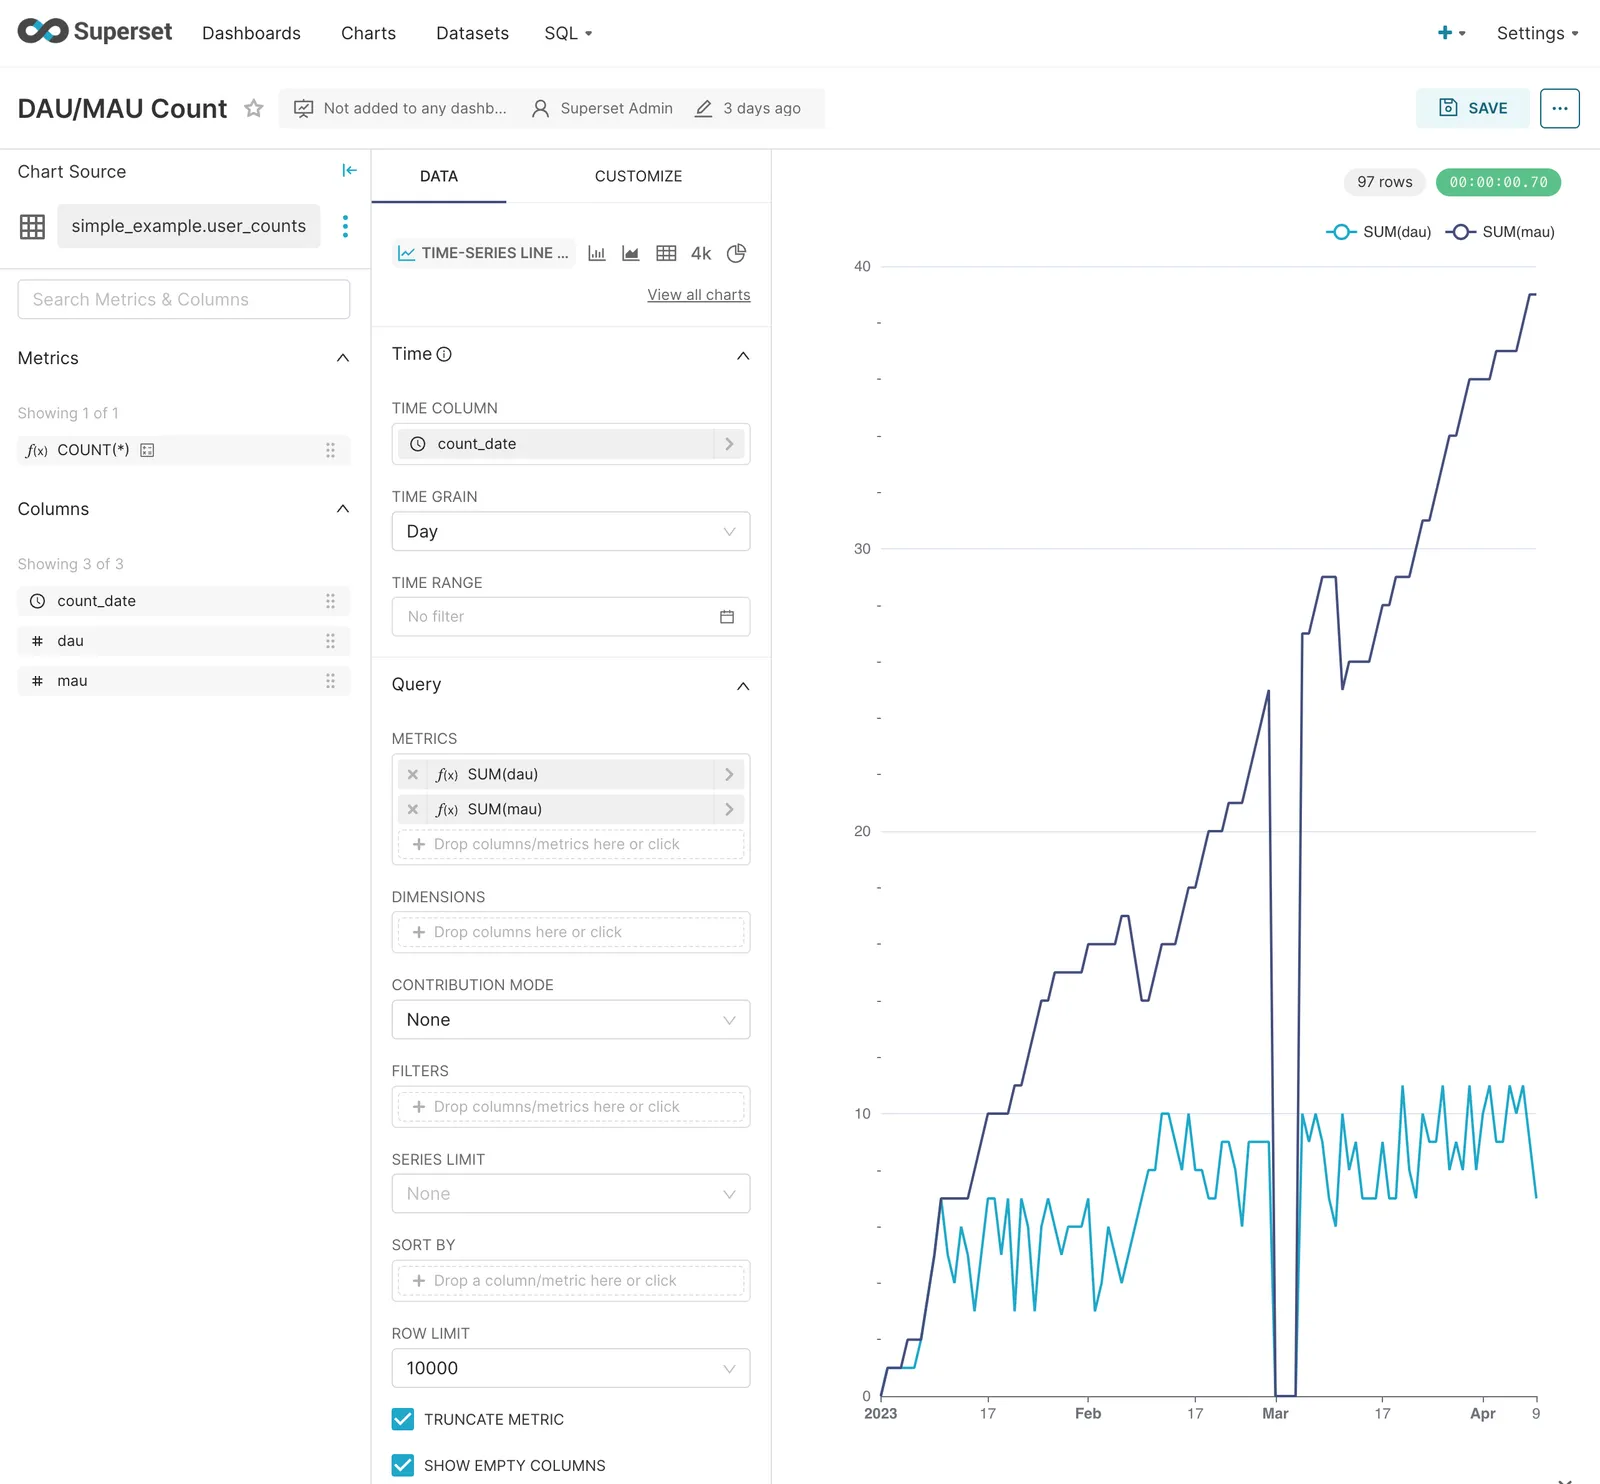
We’ve all been there. The metrics pipeline was down for the first four days of March and the data pipeline team has been working tirelessly to recover the missing data. Until the data is recovered, it’s really distracting to have that hole in the data. Temporarily, we want to show estimated DAU and MAU metrics for those four days. We want to have an audit log of what we did so no one questions the integrity of our business metrics.
With Dolt, we can either put the broken data on a branch or make the dashboard reference an estimated branch. For this example, we’ll switch the dashboard to an estimated branch. Let assume I fixed the four data points on the estimated branch.
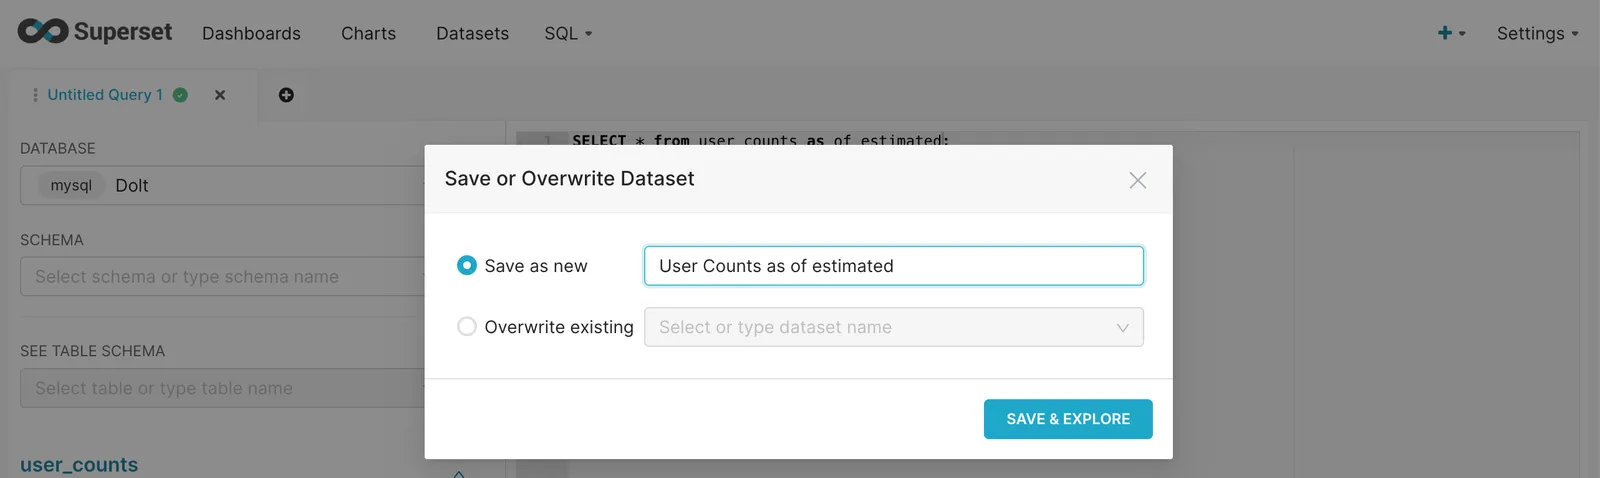
To do that I must first create a Dataset in Superset that uses the estimated branch. To do that I head over to the SQL Lab and run a select * from user_counts as of estimated.
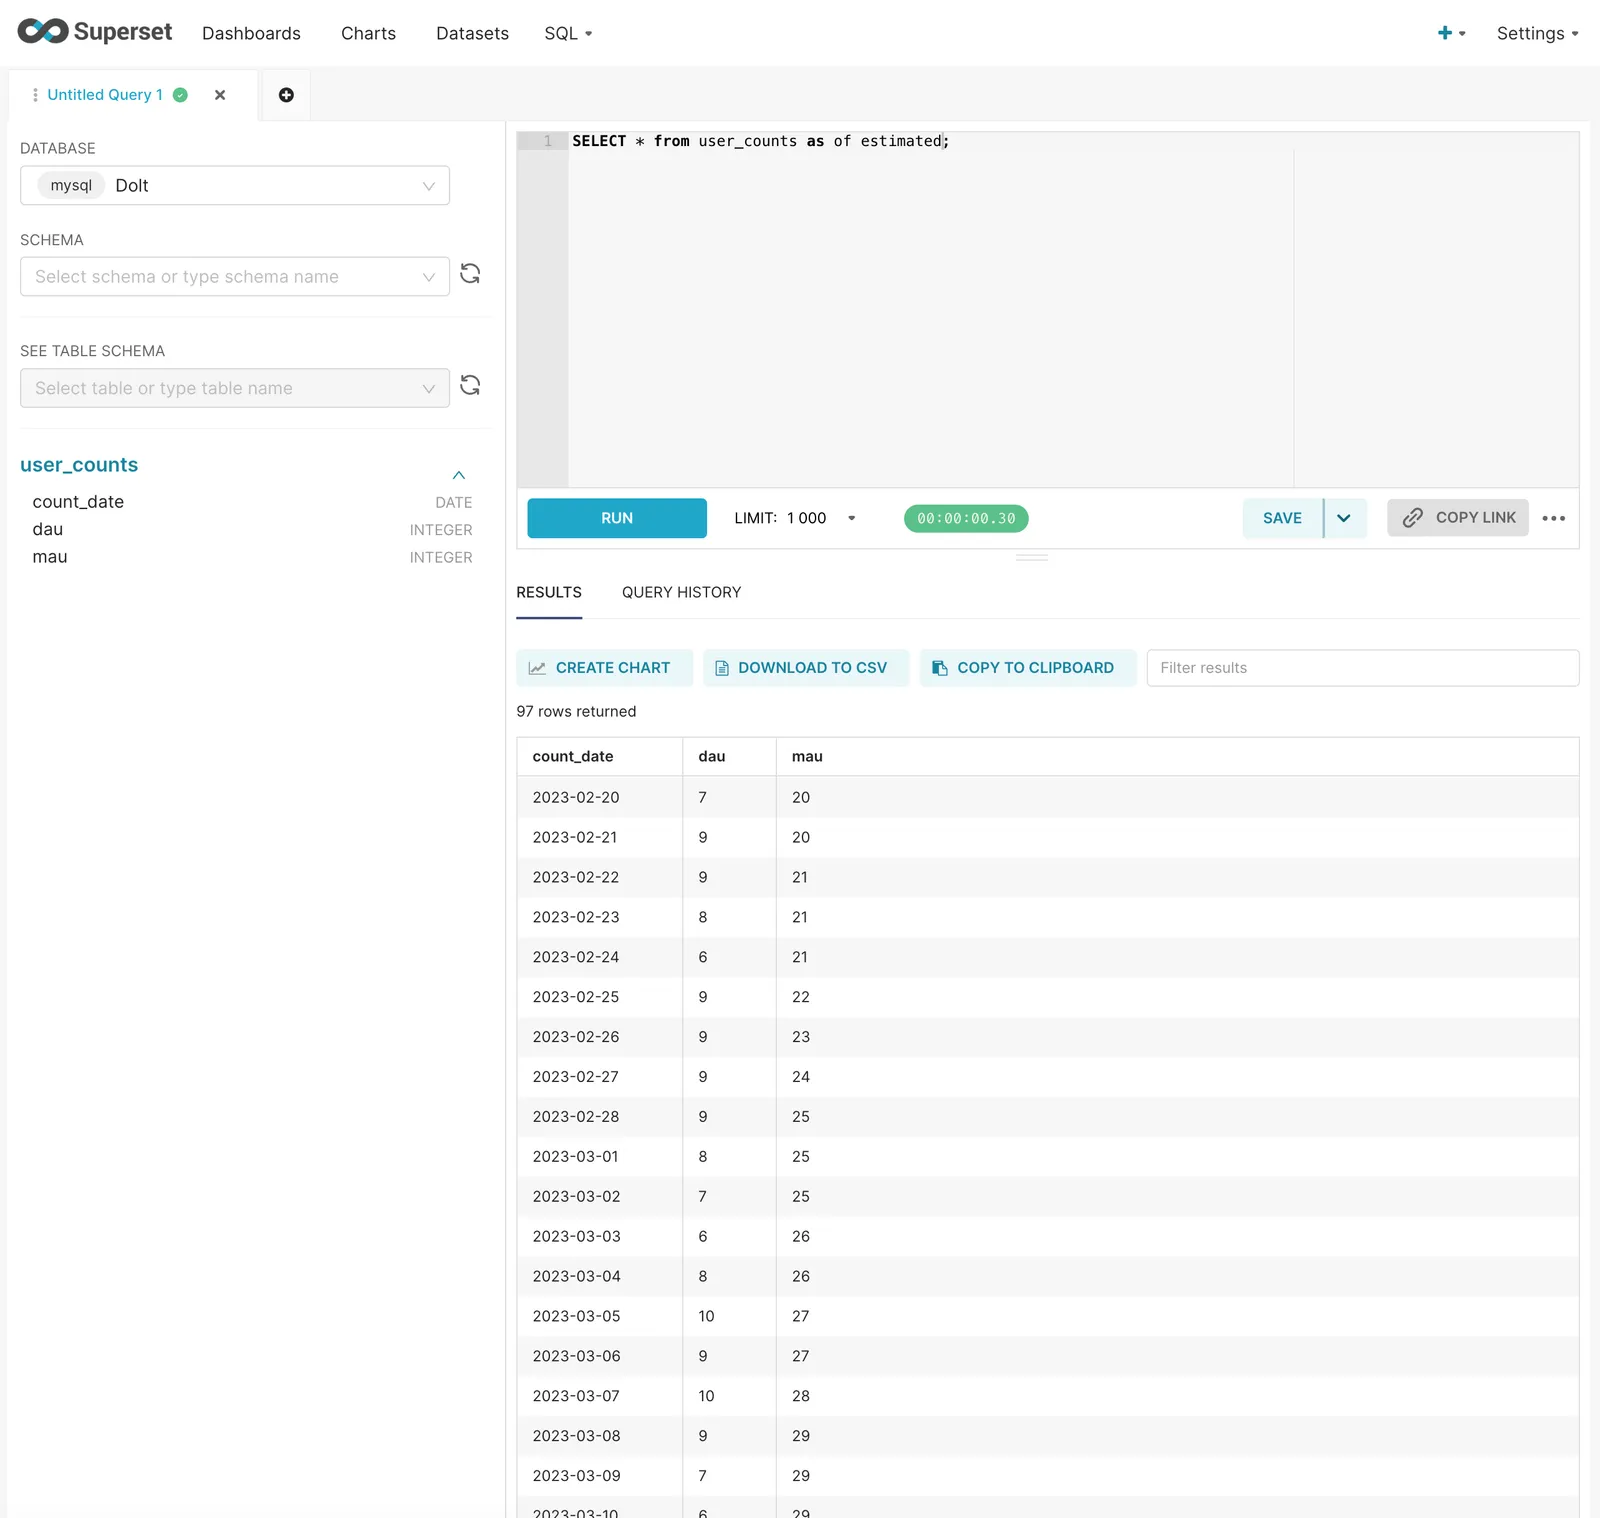
Notice the filled in values for March 1-4. Now, we create a Dataset using SAVE > Save dataset.
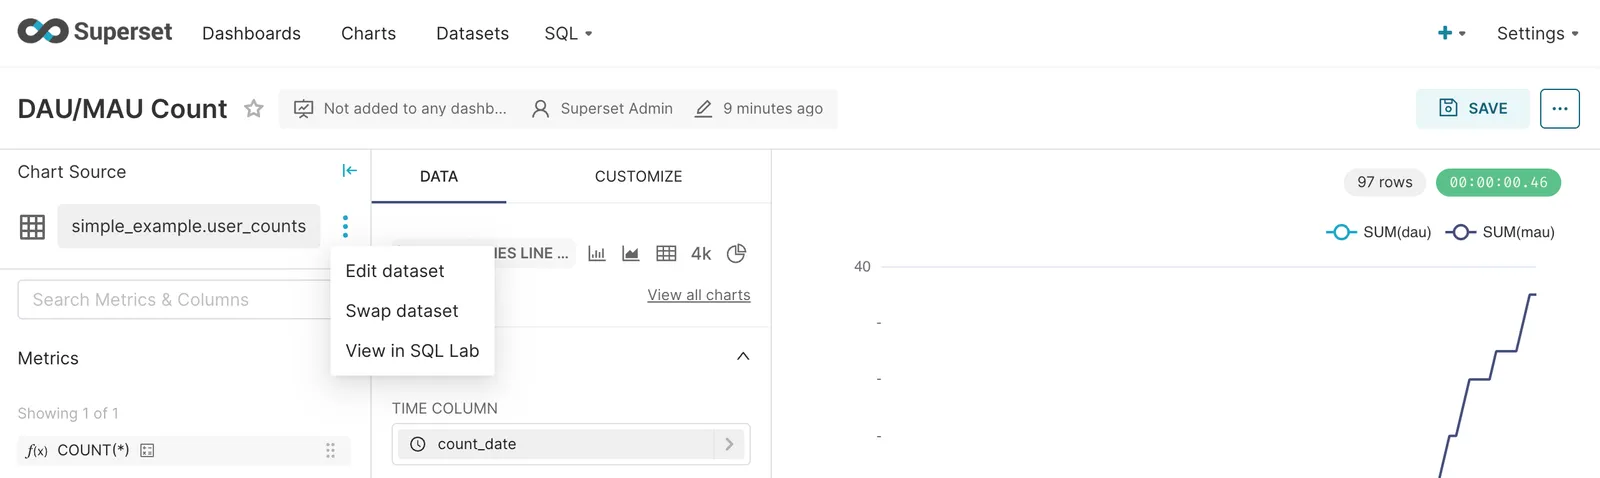
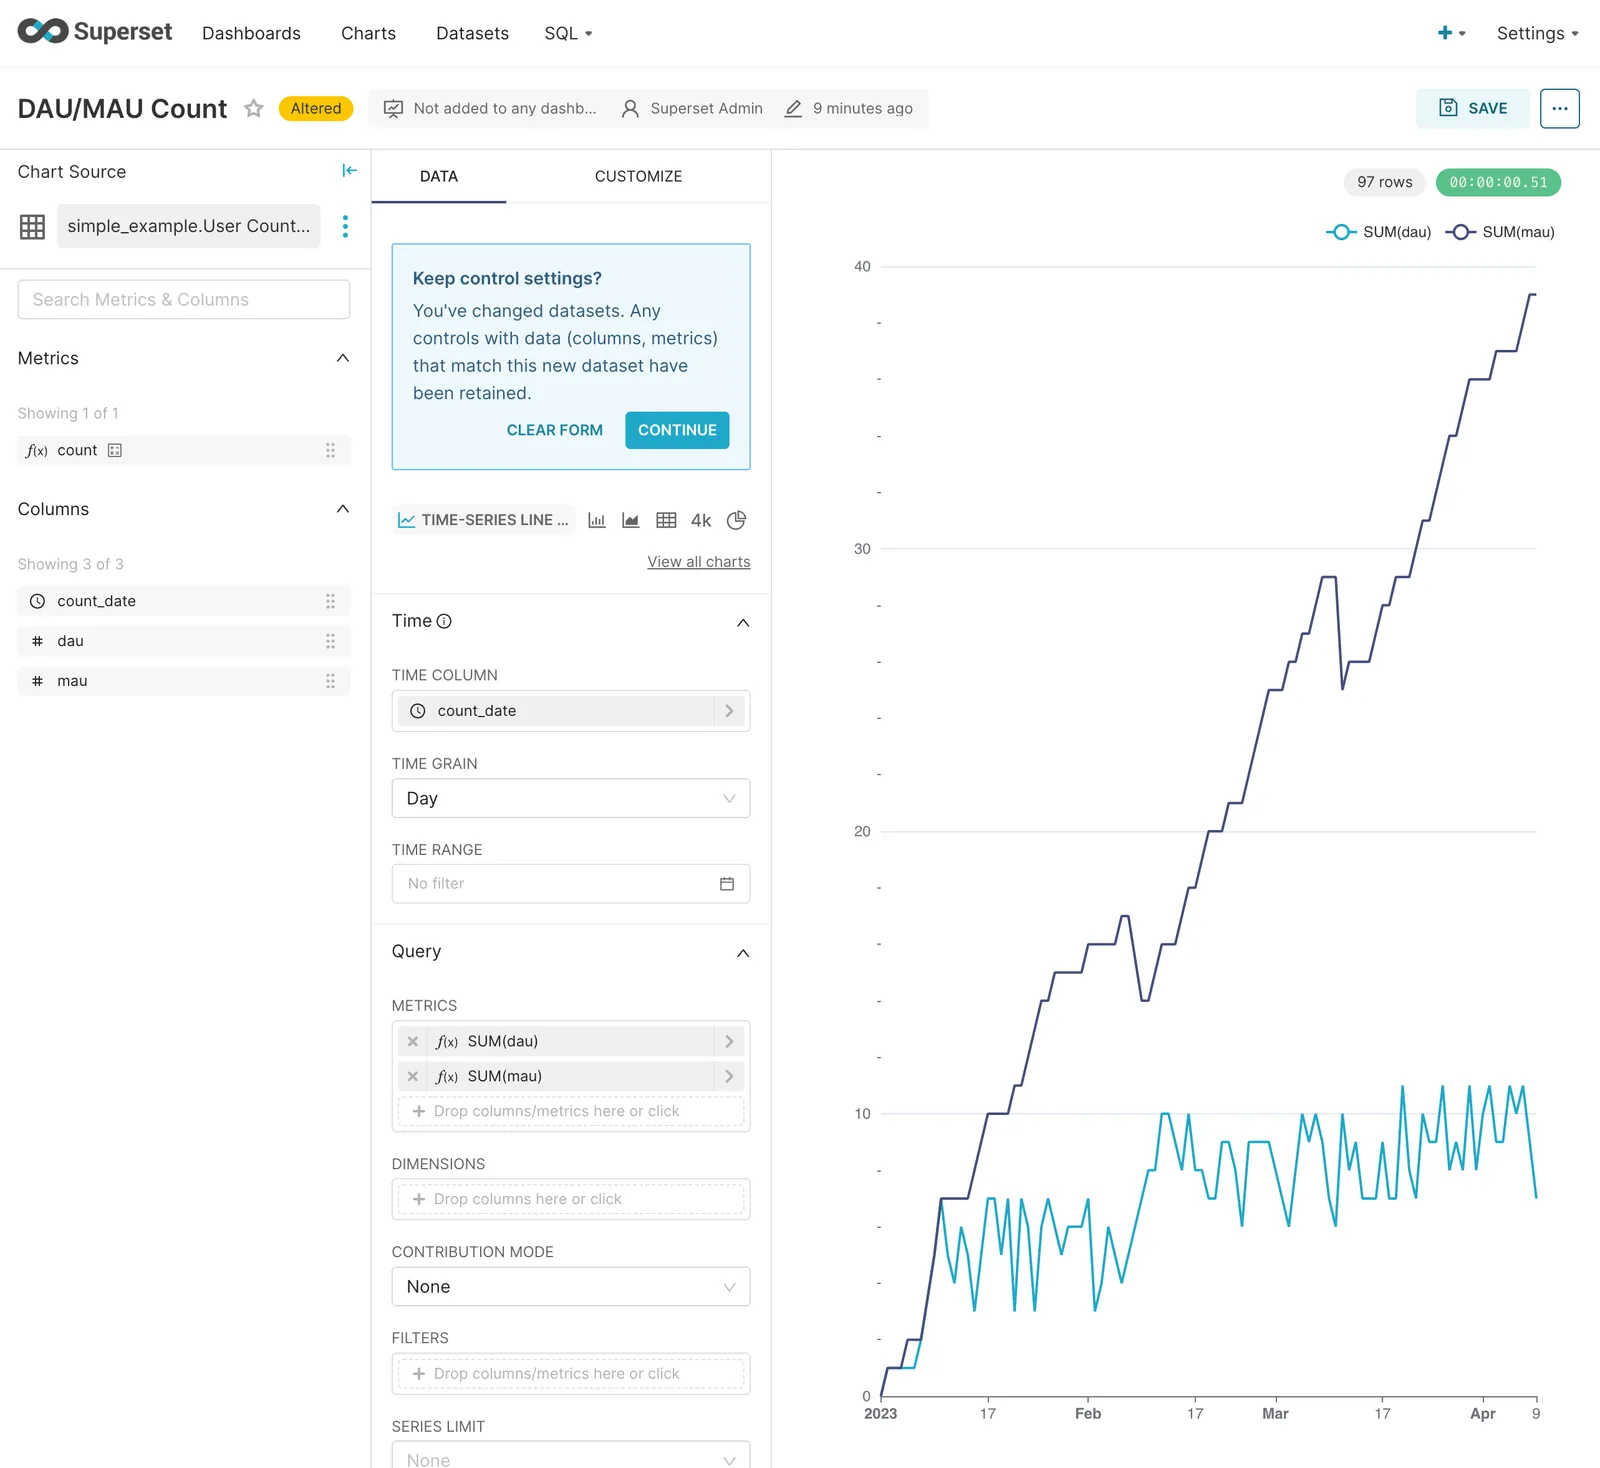
We now can click on charts and swap in the estimated dataset for the broken one.
After I click update chart, I even get a cool animation of the outage being fixed.
Once the data is fixed on the main branch I can go back to that chart. Because of Dolt, I have an audit log of the whole event, ensuring the integrity of our business metrics.
Conclusion#
Dolt provides powerful versioning features to Superset charts and dashboards. Dolt “just works” with Superset using the MySQL connector so it’s really easy to get started. The power of branches and history queries improve the efficiency of your data teams and integrity of your data. Curious to learn more? Head over to our Discord and let’s chat.