
If you haven’t heard, DoltHub is building a database. Dolt is the only SQL database you can branch, merge, diff and clone. It’s a MySQL compatible database with version control. As Dolt matures into a fully-featured relational database, a major focus of development is performance. Dolt is currently 8x slower than MySQL; making it faster is critical to its success. To understand Dolt’s performance, we have to understand the language it’s written in: Go. In general, Go strikes a great balance between performance and usability, but writing systems software in Go takes an extra level of care. Go is garbage-collected, and in the wrong conditions, GC operations can cause significant performance problems. Today’s blog is about programming patterns for Go that improve memory management and performance.
Golang Perf#
despite being a relatively new language, Go has a large, active community. Much has been written about performance in Go, how to measure it and how to optimize it. Go has great tools for profiling, specifically pprof and micro-benchmarks. For a deep-dive into Go perf, and how to use the profiling toolchain, checkout Dave Cheney’s excellent workshop. In this blog, we’re going to look at one of the trickier aspects of the Go runtime: memory allocations.
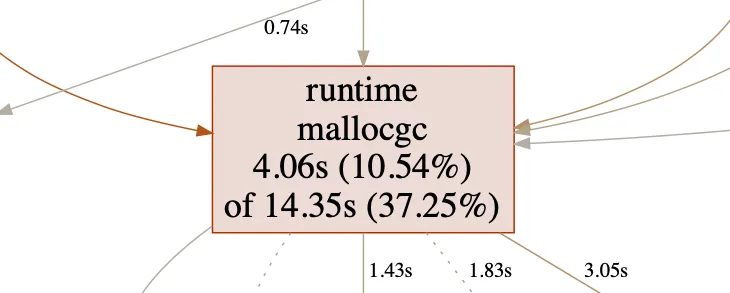
The image above was taken from a pprof cpu profile from October 2020. It’s showing the profile of a indexed join of 1 million rows. The big red box in the middle is telling us that we’re spending 37% of our time allocating or garbage-collecting objects on the heap. Ouch. This was early days for Dolt performance work, and really we were just happy that Dolt was able to do indexed joins at all. Fast-forward to our latest release and things have improved.
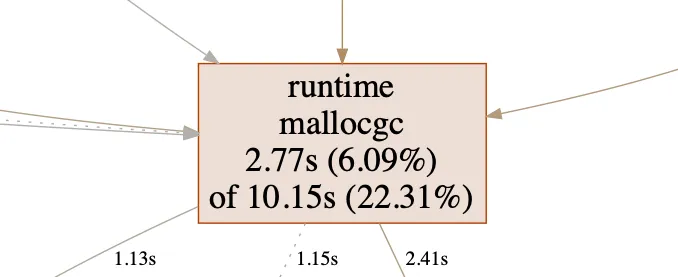
On the same query, we’re now spending half as much time managing the heap. One of most impactful changes we made that reduced GC pressure was the use of memory pools. Pools are essentially free-lists that allow you to reuse objects rather than allocating a fresh one each time it’s needed. While they are indeed an effective tool for improving performance, they’re not a silver-bullet. Objects in the pool are still heap-allocated, contributing to GC scan times. Also, managing the lifecycle of objects in the pool can be difficult, and starts to look a lot like manual memory management. What if there was a better way? What if we could write neat, tidy functions that didn’t need the heap at all?
The Stack Grows Down#
As we know, objects can live on the stack or on the heap. Stack allocated objects have a simpler life-cycle than heap allocated objects: they’re created when a function’s stack frame is written and destroyed with the stack frame when a function returns. There’s no need to ask the system for memory, and no need track down the object and clean it up later. In Go, the choice of stack or heap is decided through the compiler’s escape analysis. The compiler statically analyzes where an object is created and where it is used throughout the program. An object can’t be allocated on the stack if it’s referenced somewhere after that stack frame has been destroyed. In this case, the object is allocated on, or “escapes” to, the heap.
Let’s look at an example of these principles in practice. We’re going to refactor Dolt’s tree cursors to keep them on the stack. Indexes in Dolt are Prolly Trees. Prolly Trees have many unique attributes that power Dolt’s version control features. However, for the purposes of this example, we’ll just think of them as another kind of B-Tree. Likewise, Dolt’s tree cursors are just multi-level pointers that keep track of where we’re at each level of the Prolly Tree.
type treeCursor struct {
    node   Node
    idx    int
    parent *treeCursor
}
The structure of the cursor is fairly simple: node is the Prolly Tree node that the cursor is currently pointing to,
idx is cursor’s offset within node, and parent is a pointer to the treeCursor at the next highest layer in the
tree. treeCursors are linked together to form a path from the root node of the tree to a leaf node. Point lookups in a
Prolly Tree are performed by constructing a treeCursor at a specific point in the tree and fetching the key-value pair
that exists there:
func treeCursorAtKey(root Node, key Key) (*treeCursor, error) {
    cur := treeCursor{node: root}
    cur.idx = binarySearch(key, cur.node)

    for !cur.isLeaf() {
        node, err = fetchChild(cur.currentKeyValue())
        if err != nil {
            return cur, err
        }

        parent := cur
        cur = treeCursor{node: node, parent: &parent}

        cur.idx = binarySearch(key, cur.node)
    }

    return cur, nil
}
At each level of the tree we use binarySearch() to find the correct key index for our point-lookup. We then descend
to the next lower level of the tree using fetchChild() to get the node that the cursor is pointing to. When we’re
finished, the cursor is pointing inside a leaf node to the index entry we’re searching for.
This is all great, but what about memory allocations? Let’s set up a benchmark and measure our memory allocations. We’ll create a Prolly Tree with 10K key-value pairs and perform 100K random point lookups on it. Using pprof’s memory profiler, we can see how many objects are put on the heap and where they’re coming from.
func benchmarkProllyMap(b *testing.B) {
    prollyTree, keys := generateProllyBench(10_000)
    b.Run("benchmark prolly map 10k rows", func (b *testing.B) {
        N := len(keys)
        for i := 0; i < 100_000; i++ {
            key := keys[rand.Uint64() % N]
            _ = prollyTree.Get(key, func (_, _ val.Tuple) (e error) {
                return
            })
        }
    })
}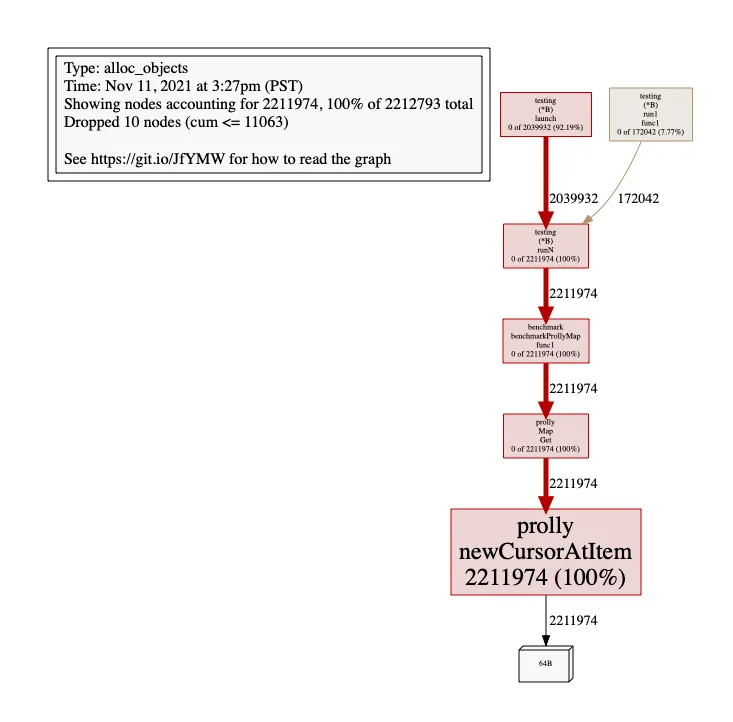
Something is making a whole lot of garbage! Thankfully the Go toolchain comes to the rescue again. Go’s compiler has a
flag to log escape analysis information: go build -gcflags="-m=1 -N -l". Looking through the log output, we can see
the following line
store/prolly/tree_cursor.go:71:3: moved to heap: parentReading through our implementation of treeCursorAtKey(), we see that we’re making a heap allocation each time we point
a treeCursor at its parent. The compiler can’t statically determine the lifetime of this struct once we take its
address, so it must be allocated on the heap. We need a new design for treeCursor that will make it friendlier to stack
allocation. Instead of storing each part of the cursor separately and linking them with pointers, let’s store the parts
together in a slice.
type treeCursor []nodePtr

type nodePtr struct {
    node Node
    idx int
}
Next, we’ll refactor our search function to take a treeCursor as an argument, rather than returning one.
func treeCursorAtKey(root Node, key Key, cur treeCursor) (err error) {
    l := root.level()

    cur[l].node = root
    cur[l].idx = binarySearch(key, root)

    l--
    for l >= 0 {

		cur[l].node, err = fetchChild(cur[l:].currentKeyValue())
        if err != nil {
            return err
        }
        cur[l].idx = binarySearch(key, cur[l].node)

        l--
    }
    return
}
This is a key design difference in the API. If we allocate the treeCursor within this function and return it, the
object must go on the heap as this stack frame will be destroyed on return. By taking the treeCursor as an argument,
we allow it to be created by the caller and only mutated within the search function. At the call site, the new design
looks like this:
func foo() {
    var arr [16]nodePtr
	cur := treeCursor(arr[:])
	treeCursorAtKey(root, key, cur)
	key, value := cur.currentKeyValue()
}
The calling function foo() first creates an nodePtr array. Arrays in Go are value types, meaning that arr is a
contiguous block of memory large enough to hold 16 nodePts. We then “slice” arr to create our treeCursor and pass
it to our search function to initialize it. Slices are reference types, they hold a pointer to their backing array.
Because we’re passing a memory reference down the stack, the compiler’s escape analysis determines that arr can be
allocated on the stack. On the other hand, if we return our treeCursor and pass the reference up the stack, the
backing memory array would have to be put on the stack. The differences in design are subtle, but the differences in
benchmark performance are significant.
Before
  BenchmarkProllySmall/benchmark_prolly_map-12            1000000000               0.1295 ns/op          0 B/op          0 allocs/op
  PASS
  ok      github.com/dolthub/dolt/go/store/prolly/benchmark       1.758s

After:
  BenchmarkProllySmall/benchmark_prolly_map-12            1000000000               0.1099 ns/op          0 B/op          0 allocs/op
  PASS
  ok      github.com/dolthub/dolt/go/store/prolly/benchmark       1.287s
The new implementation makes zero allocations and our benchmarks are ~15% faster. Faster point-lookups are a definite win, but this benchmark doesn’t capture the full performance impact of eliminating allocations. Recall the indexed join profile from earlier. The 22% of time spent on GC was the result of cumulative allocations throughout the program, not from a single source. When small allocations are made up and down the stack, the garbage collector has to do significantly more work to mark and sweep them.
More to Come#
Dolt’s performance journey is young. We recognize that it’s critical to our success, and we’re committed to rapidly improving. Incremental optimization work, such as the refactor detailed in this post, is vital to improving Dolt’s resource utilization. It’s part of a large effort to rewrite our storage format and persistence layer. Our goal is to be within 2x of MySQL’s performance while offering a richer feature set. We hope that you’ll join us along the way. If you have any questions, or you’d like to learn more about Dolt, join us on Discord.