
For growing software startups offering online products and services, there comes a time when having on-call engineers becomes a necessity. As customers and service level agreements begin to increase, someone needs to always be available to address emergency situations that inevitably arise—ensuring the startup won’t lose the customers it’s worked so hard to build relationships with.
But, when is the right time to add an on-call rotation to your startup? And, how do you go about doing so?
Today I’ll share how we’ve implemented an on-call rotation at DoltHub, so you can feel confident doing the same for your company.
When to introduce on-call#
Deciding when to add an on-call rotation to a startup is definitely more art than science. There are a number of factors to consider when deciding whether to add on-call, and the same was true for us.
Some questions to evaluate when deciding whether to add on-call, and whether to add on-call now, fall into two categories: customer concerns and engineering concerns.
On the customer side of the coin, you may ask yourself: do customers rely on, or have contracts guaranteeing, service uptime? Are they active during the same hours as my engineering team? And, how frequently does our product or service have outages or customer-impacting events?
On the engineering side of the coin, you might ponder: do we have enough engineers to support a (relatively fair) on-call rotation? Are we able to train and on-board engineers into the rotation so that they can perform the required work? And, what infrastructure is required to stand-up a credible, automated paging system?
Here at DoltHub, our team delayed introducing an on-call schedule for quite some time. In fact, we only created one for DoltHub.com in late July of this year, though we’d been discussing adding it for well over a year. What motivated our delay is that we’ve been able to serve our DoltHub customers quite well via Discord alone.
On Discord, our customers chat directly with our team and with our CEO Tim, and we’ve established a reputation of being extremely responsive and providing blazing fast turnaround on issues.
As a result, Discord has been a invaluable resource that’s allowed us to prevent installing an official on-call rotation for DoltHub, so we could focus on building more important customer features instead (that said, we’ve actually had a permanent on-call engineer for HostedDolt, our founder Brian, since it launched back in May 2022. Thanks Brian!).
The benefit of having an open, real-time chat channel available to customers, which is also used as our team’s internal chat, is that it functions as an informal paging system out-of-the-box.
Customers can ping our team when issues occur, and we’ll respond and resolve them. The downside of this informal system, though, is just that—that it’s informal. This means that no one person is designated to address any off-hour emergencies at any given time, although chances are good Tim is online, rain or shine.
The tipping point for us to finally prioritize adding an on-call rotation to our team came in early June when we migrated DoltHub.com from PostgreSQL to HostedDolt, a process that caused a couple interruptions for our international customer base. When these incidents occurred, our customers reached out to us on Discord to report it, but it was off-hours for our US west coast based team, so we didn’t address the issues for a number of hours.
It was at this point we knew we could not solely rely on Discord any longer and set out to implement an automated paging pipeline and on-call rotation so emergencies get fixed as quickly as possible.
Automated paging with Prometheus and AWS#
There are numerous products, services, and tools available to help teams set up automated paging. Since DoltHub uses AWS as its primary cloud provider, we decided to build our paging infrastructure using its suite of services.
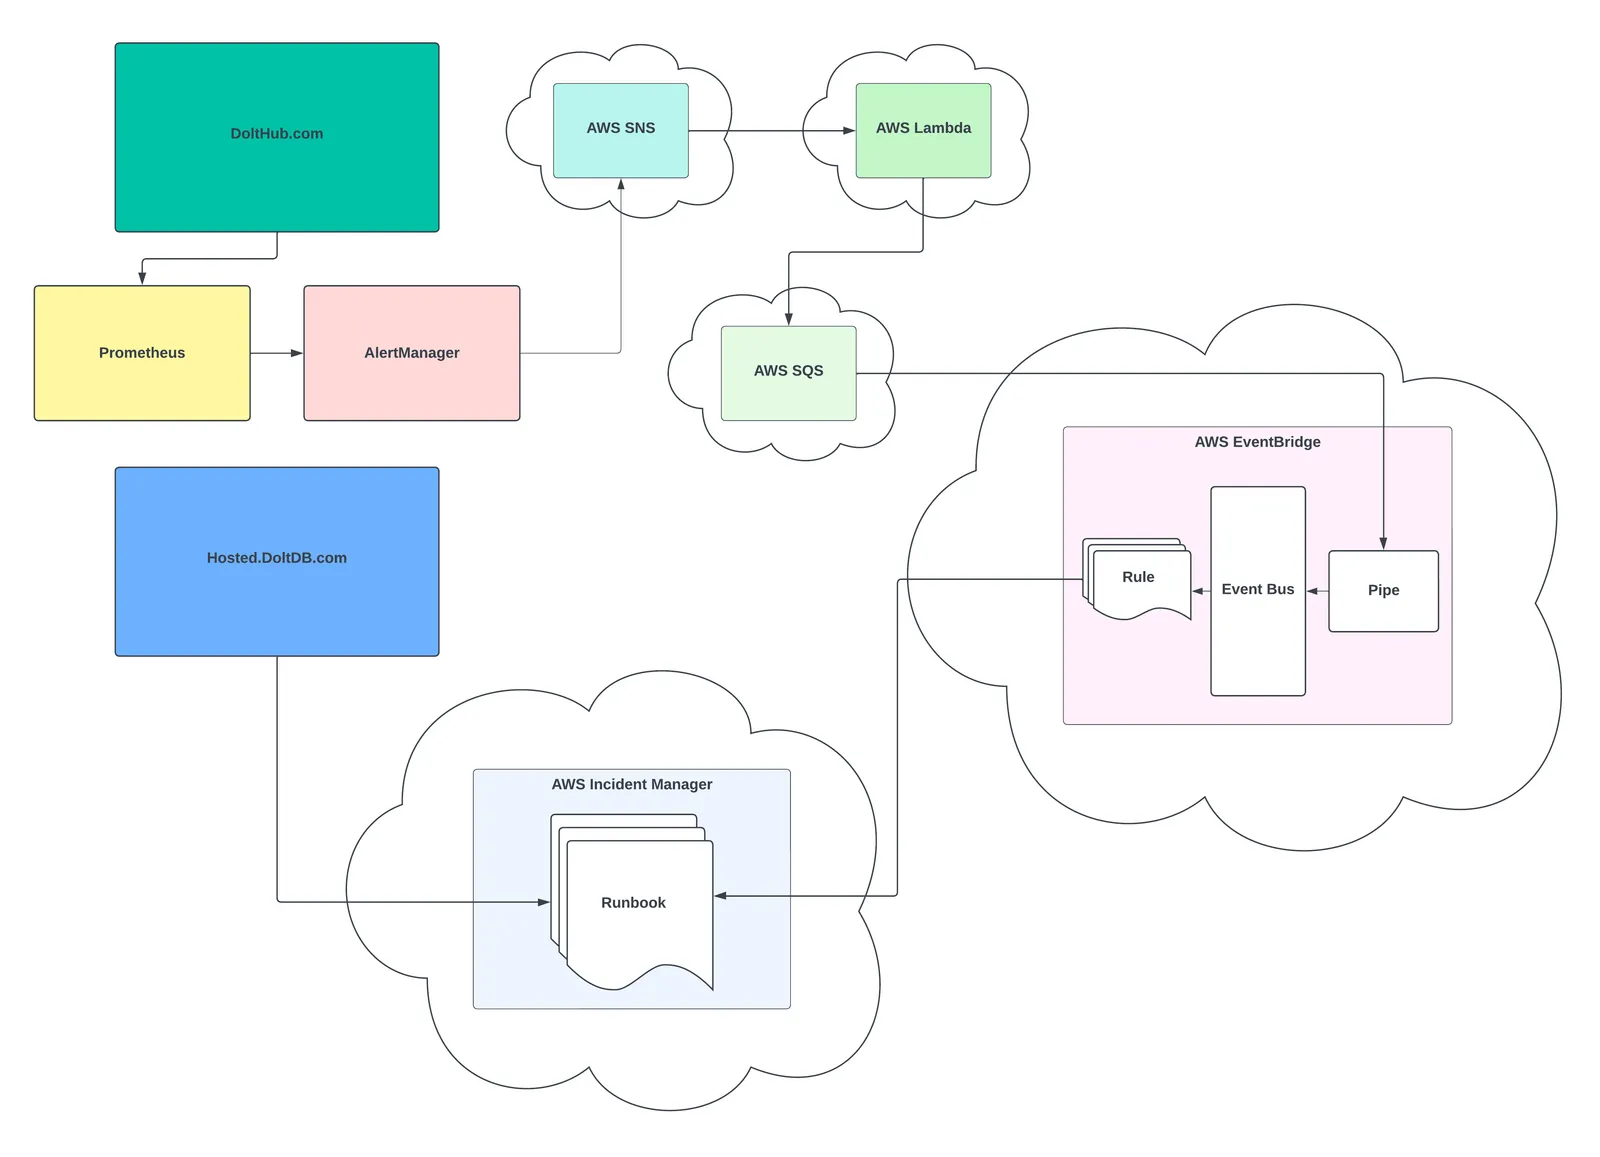
As you can see from the illustration above, there are quite a few AWS services involved in our paging pipeline for DoltHub.com, so we’ll look at each service individually and its specific role in the pipeline. However, it’s important to note that the pipeline illustrated above is how we implemented fully automated paging for DoltHub.com, and is by no means required for much simpler paging schemes.
AWS has a service called Incident Manager that’s used for paging, engaging with and resolving incidents, and managing on-call rotations. In a simple case, this service’s API can be used directly for paging on-call engineers and tracking incidents. In fact, HostedDolt allows customers to create incidents that page our on-call engineers, right from its dashboard. And, the implementation for this is much more straightforward than the diagram above. When a customer uses the incident form on HostedDolt, the HostedDolt API uses the AWS Incident Manager API to create and track the incident in Incident Manager.
For DoltHub.com, however, there’s no such customer-facing interface for directly paging a team member (just Discord as mentioned earlier). As a result, we needed a way to get paged automatically if our monitoring service, a Prometheus instance, detected any service outages or degradations. It was this requirement for fully automated paging that led to the infrastructure you see in the diagram above.
Let’s start by discussing DoltHub.com, Prometheus, and another service provided by Prometheus called AlertManager.
DoltHub.com consists of several Golang servers running the backend APIs, a GraphQL service that sits between DoltHub.com’s frontend and backend, and a Next.js frontend server. Each of these services are monitored by Prometheus which scrapes metrics from these services, their proxy servers, and their hosts.
Prometheus, or a monitoring service of your choice, is really the starting point for automating paging since it can detect when services or hosts are down or negatively impacting customers.
AlertManager, which we deploy next to DoltHub.com, sends alert notifications based on predefined Prometheus queries and can easily integrate with a number of tools including email, Slack, WeChat, and PagerDuty.
As an example, to receive an alert from AlertManager when Prometheus detects a service is no longer live, you can alert on the Prometheus query: sum(up{app="dolthubapi"}) == 0 OR absent(up{app="dolthubapi"}) > 0. This can be read as, alert when the total (sum) of “up”, or live, dolthubapi instances is equal to zero, or alert when the there are no dolthubapi instances at all (absent).
Unfortunately, at least at the time of this blog, AlertManager does not support an integration with Discord directly. If it had, our automated paging pipeline might have looked much different. It does, however, support integrations with AWS’s Simple Notification Service (SNS) which, itself, can be integrated (albeit somewhat indirectly) with Incident Manager. So, we decided to use SNS as the first (or third, rather) component of our paging pipeline.
SNS is a pub/sub service where publishers write messages to “topics”. Subscribers to a topic can then read these messages and do something with them. For our purposes, DoltHub.com’s AlertManager instance is the publisher. It writes messages to a topic called dolthub_alerting and each message includes information about the fired alert, which will eventually be routed to Incident Manager, triggering a page and the appropriate response by our engineering team.
The subscriber to the dolthub_alerting topic is a serverless function running on AWS Lambda. This function reads all the messages published to the SNS topic and transforms the message shape before writing a new version of the message to AWS’s Simple Queue Service (SQS).
Now, it’s possible for SQS to subscribe directly to the dolthub_alerting SNS topic, however, adding the additional Lambda step between these two services gives us much more flexibility on the shape of the message data before it reaches its final destination. We found that without this additional Lambda function step, the message shape defined by AlertManager was a bit too rigid to achieve the routing behavior we wanted further downstream.
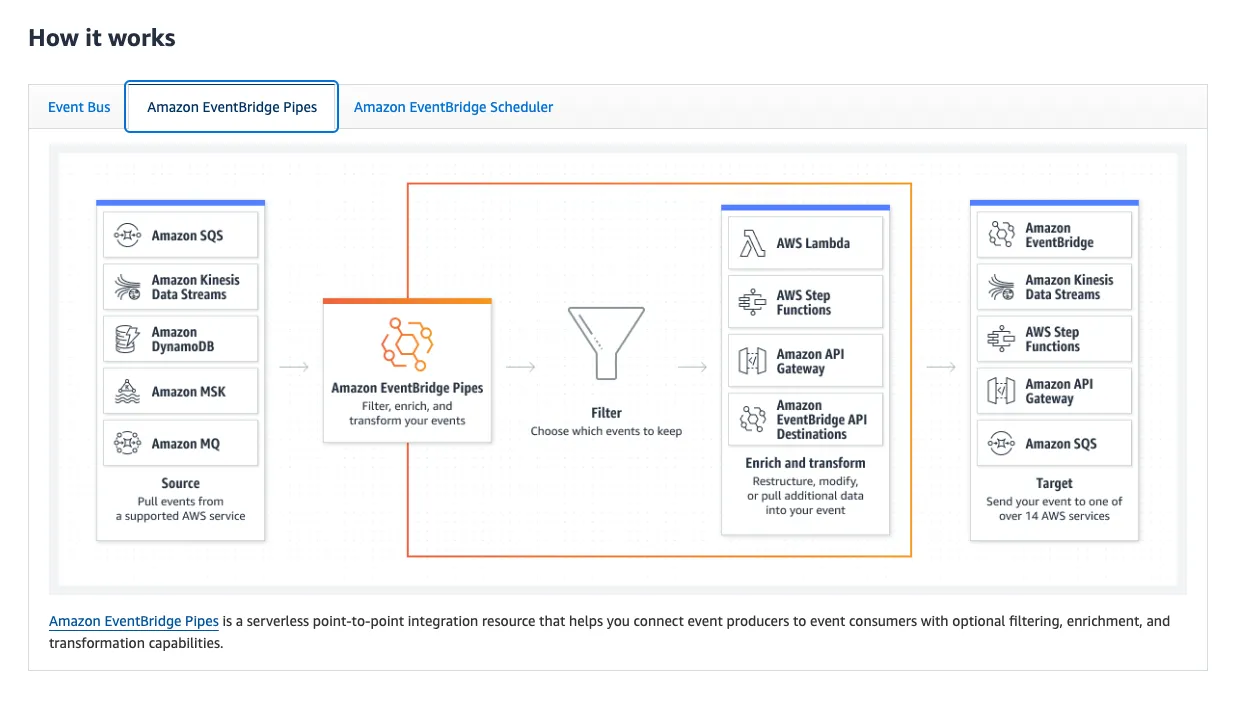
After the Lambda function transforms the SNS message, it writes a new message to SQS, a managed, highly scalable messaging queue. Importantly, SQS can be easily configured as a data source on AWS EventBridge, which is the main service that integrates with Incident Manager.
EventBridge manages event buses that also follow a pub/sub model, but, importantly, allows subscribers to subscribe to certain types of events that they care about, instead of subscribing to all events written to the event bus. This event filtering allows us to route messages from SQS (messages become “events” in EventBridge) to a particular EventBridge “rule”. A rule is the subscriber of a certain type of event. Each rule has a target, which is often another AWS Service. When a rule is triggered (meaning it receives an event of the type it is subscribed to) it executes an action on its target service.
Let’s look more closely at how this works.
Using EventBridge’s feature called Pipes, we are able to select the SQS queue we discussed earlier as a data source. This means that messages in the SQS queue will be read by the pipe and written to one (or more) pipe targets. In our case, the target we configured is an EventBridge event bus on which we’ve defined rules for every alert that comes from AlertManager.
Crucially, our event bus rules are all targeted at Incident Manager “runbooks”. A runbook is an automated process triggered when an incident is created on Incident Manager. This process aids the on-call engineer in diagnosing and resolving the incident, by providing them relevant documentation, monitoring insights, and will even execute scripts or trigger other automated processes on their behalf.
So, when an alert event of a certain type is written to the EventBridge pipe, let’s say it’s the dolthubapi is down alert, the rule matching that event type creates a new dolthubapi is down incident in Incident Manager automatically. This pages the on-call engineer, then begins executing the proper runbook related to this alert.
Phew! Quite a few elements working together to understand there, and a lot of specific AWS terminology. But this stuff is pretty cool, and more importantly, it’s robust and highly scalable! One major benefit to implementing a paging pipeline in this way is that we don’t need to maintain any of these individual components or services ourselves, something we considered before going down this cloud-based path.
On-boarding on-call engineers#
Once automated paging is set up, you’ll need to select members of your engineering team for on-call rotation and ensure they’re equipped to handle any emergencies that might arise. If your growing engineering team is anything like ours, not every on-call engineer will have previous on-call experience. They also might not have intimate knowledge of the systems they’ll be responsible for maintaining.
This is why a solid on-boarding process is an important element to setting up on-call at your startup. We’ve come up with four important tenets to use to successfully on-boarding on-call engineers:
- Communication
- Documentation
- Tooling
- Collaboration
Communication#
Understandably, engineers, especially those without prior on-call experience or expertise in the systems they’ll be responsible for, might get nervous at the thought of being on-call. Part of a successful on-boarding experience is helping to alleviate your engineers fears, and empower them to perform their duties. And a big part of doing this is maintaining open and honest communication about the on-call experience.
As mentioned earlier, our team uses Discord for internal communications, and this is our primary tool for enabling open communication among our on-call engineers. We encourage our on-call team to ask any questions they have in an internally visible chat server, as opposed to asking in private messages, so that other on-call engineers who likely have similar questions, or want to keep up with the latest information, can view them.
We also try and encourage our entire on-call team to participate in answering questions when they come up. This way, everyone gains more knowledge and confidence together. When an on-call related question appears in Discord, instead of having the domain expert answer the question directly, we reach out to learning on-call engineers and get them to participate in the discussion. It’s possible one of them knows the answer already, and can chime in, or the team might be able to deduce the answer by discussing together. This encourages active learning, and helps the team feel more comfortable sharing knowledge and experience openly.
Documentation#
It’s also important to have documentation your on-call team can easily reference. It’s generally a good idea to have as much documentation as possible, but documentation can also be a maintenance burden. In our experience, documents at a growing startup go stale fairly quickly.
Our approach to on-call documentation has been to write a guide our engineers can follow to on-board themselves into our paging rotation. This guide provides instructions for setting up their local environment, installing tools, interacting with AWS Incident Manager, and even provides them an overview of the systems they’ll be responsible for monitoring. This document also includes an example of how to work through the diagnosis and resolution of an incident, so that they aren’t figuring out how to do so when there’s a real incident.
As the on-call engineers work through the on-boarding document, we also ask them to improve it themselves. If they find an issue with the document, or want to add some additional information, we encourage them to update it so that the next engineer working through the on-boarding process has better experience getting up to speed.
Another crucial piece of documentation we provide our on-call engineers are the runbook, automated documents in Incident Manager. When an engineer is paged, and an incident is created, Incident Manager begins executing an automated document defined in the given response plan.
This document is broken down into clear stages the engineer can follow at the time of an incident, to diagnose, fix, and resolve an incident. Let’s look at an example document.
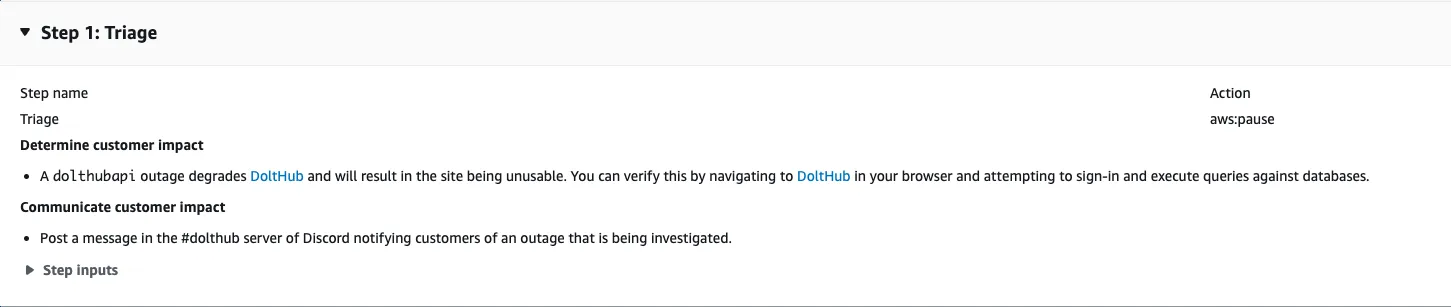
The image above shows the “Triage” stage of an automated document that is triggered if dolthubapi goes down. When an on-call engineer receives a page and views the incident, this document and its stages will appear.
The triage stage is the first of four stages, and provides the responding engineer clear directions for verifying that there is in fact an outage and that customers are affected by it. It also instructs them to notify our customers on Discord.
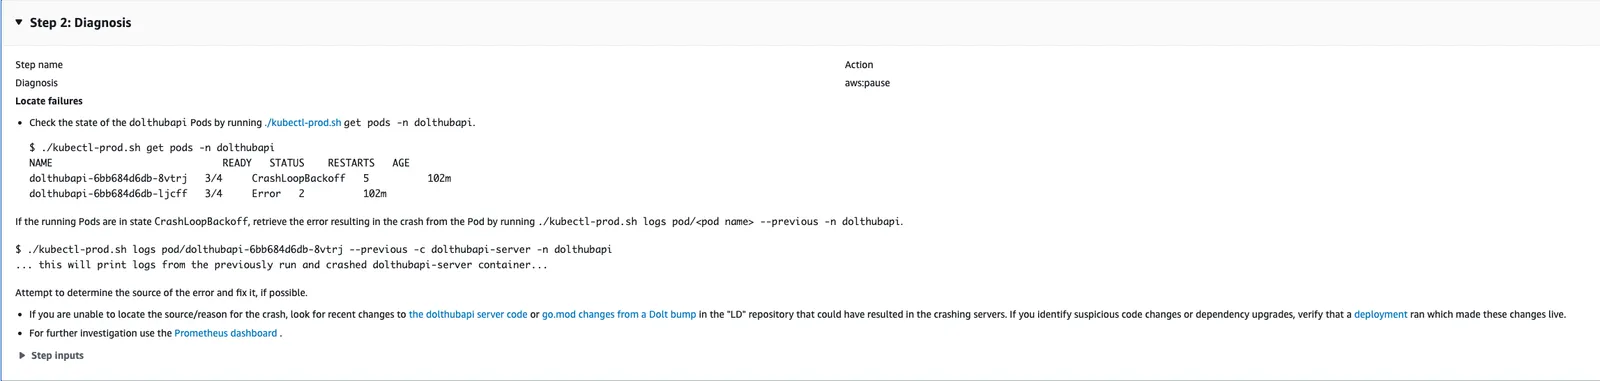
After performing the steps in the Triage stage the engineer will move to the Diagnosis stage. This stage tells the engineer to investigate the state of the down service using their on-call tooling. It also instructs them to look for recent code changes and deployments that might have introduced a bug or regression. Fixing the outage might only require they revert this change.
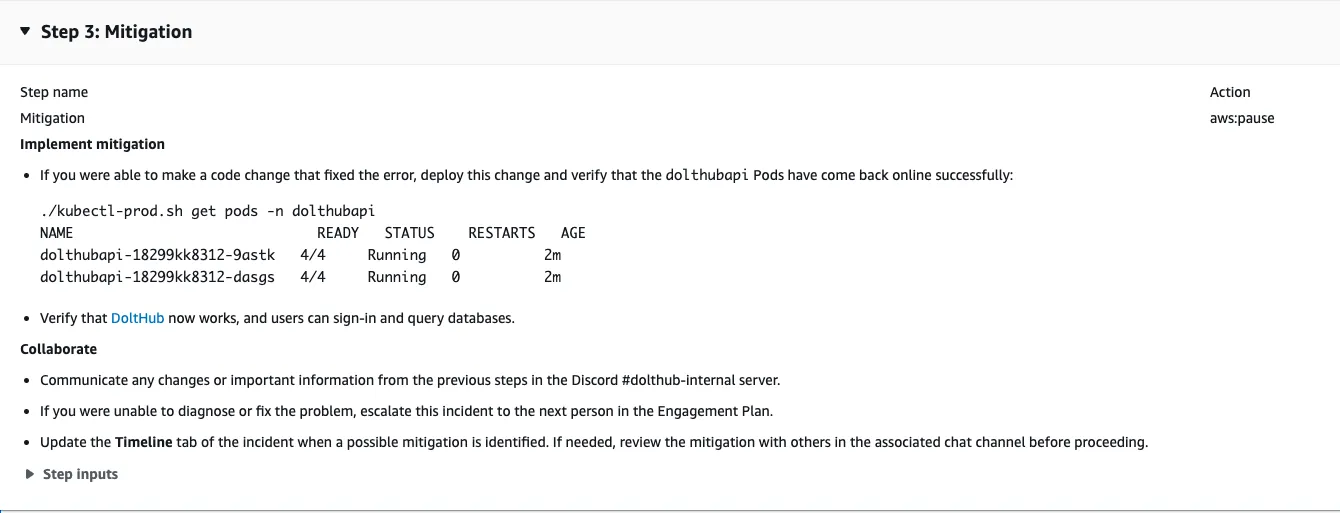
The third stage is the Mitigation stage. If the engineer was able to fix the problem or revert the breaking change, they can now verify that the service has recovered and is no longer impacting customers. But, if the engineer is unable to fix the issue alone, this stage tells them to engage, or page, the secondary engineer in the on-call rotation. This ensures that each engineer can receive help during an emergency, if they need it.
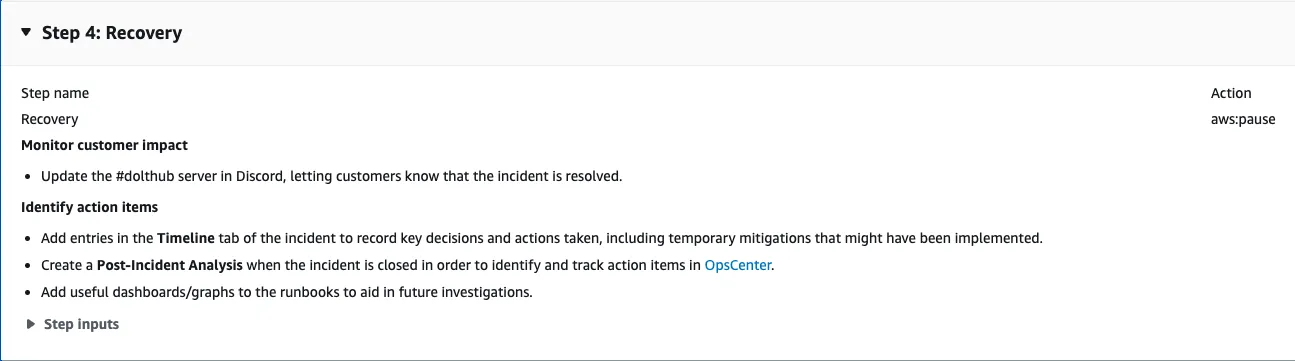
The final stage in the document is the recovery stage. This stage instructs the engineer to notify the customers on Discord that all services are up and running again and tells them to write a post-incident analysis, which can be viewed by the team at a later date to discuss out to prevent outages in the future and improve upon the incident response plan.
These automated documents are essential to guiding the on-call team through incidents, and should be regularly improved and maintained.
Tooling#
When setting up an on-call rotation at your startup, you also need to provide the on-call team with the right tools they need investigate and intervene on incidents. At larger companies, many on-call processes are automated, but at a startup, manual tools are likely required.
For our on-call team working with DoltHub.com, we provided tools for easily retrieving service logs, monitoring real-time metrics of each service, and deploying service changes.
These tools include scripts for executing authenticated kubectl clients to read DoltHub’s service logs, which run on Kubernetes, links to Prometheus graphs that are commonly used during outage investigations, and service deployments via GitHub Actions, a convenience we’ve had for quite some time now.
Each of these tools are foundational for a nascent on-call rotation at a startup. The goal of creating tools for the on-call team isn’t to make them perfect, but to iterate on them over time, making them easier to use and more efficient, so your team can put out fires quickly.
Collaboration#
The final, and most important element to successfully on-boarding on-call engineers is to foster an environment of collaboration. Again, the scariest part for new on-call team members is to feel like they’re totally alone during their shift, when they might not have experience doing the tasks they’re required to do. This fear stems from their uncertainty whether they can ask for help when they need it, or will receive help when they ask.
For this reason it’s important to create a culture of collaboration and support, especially for the less senior members of the on-call team. And, it’s important for the more senior members of the team to provide that support.
At larger companies, new on-call members often start by shadowing rotations of the senior members. This is easier to do in that context, since there are likely far more incidents to experience due to the sheer size of the company.
At a growing startup, though, shadowing isn’t very practical. Real incidents are far less frequent, so the alternative strategy we’ve employed has been putting our most senior on-call members as the second and third responders to pages.
This means that when a page occurs, the engineer on-call will respond, and then, if they need additional help, they can easily escalate the page to the senior engineers. At this point the senior engineer and the responding engineer will work together to resolve the incident. The aim is for the responding engineer with to gain tips and insights from the senior, giving them more confidence to resolve incidents on their own, as they gain more experience.
This system of support provides newer on-call members a much needed safety net of support so they know that they can always receive help in the moment, if they get stuck.
Conclusion#
Hopefully this glimpse into how we’ve created an automated paging pipeline and on-call rotation at DoltHub can help you decide how and when to add an on-call rotation at your growing startup as well. Though still new for us, we’ve found success using Incident Manager on AWS and it’s new On-call Schedules feature.
This feature allows you to schedule on-call rotations for different teams, and view each shift in a calendar. It’s also easy to use “shift overrides” in the event an engineer needs on of their shifts covered.
We love getting feedback, questions, and feature requests from our community so if there’s anything you’d like to see added in DoltHub, DoltLab or one of our other products, please don’t hesitate to reach out.
You can check out each of our different product offerings below, to find which ones are right for you:
- Dolt—it’s Git for data.
- DoltHub—it’s GitHub for data.
- DoltLab—it’s GitLab for data.
- Hosted Dolt—it’s RDS for Dolt databases.