
Data Quality Control is a big, broad topic. So, I’m warning you in advance, this article is going to be long, like 4,000 words long.
Here at DoltHub we built the world’s first version controlled SQL database, Dolt. In traditional software development, version control is a critical tool used to ensure code quality. Human review powered by diffs, isolated development branches, and the ability to roll back bad changes all contribute to code quality. Can the same concepts be applied to data to ensure data quality? This article will try to answer that question.
To set that up, we first need to answer a few questions. In modern software organizations, how is data created, stored, and used? What is data quality in these different contexts? What tools exist today to achieve better quality data?
The Modern Data Stack#
Let’s watch how a modern data stack generally evolves in a software organization. As I go, I’ll explain where data quality issues tend to pop up.
The Application#
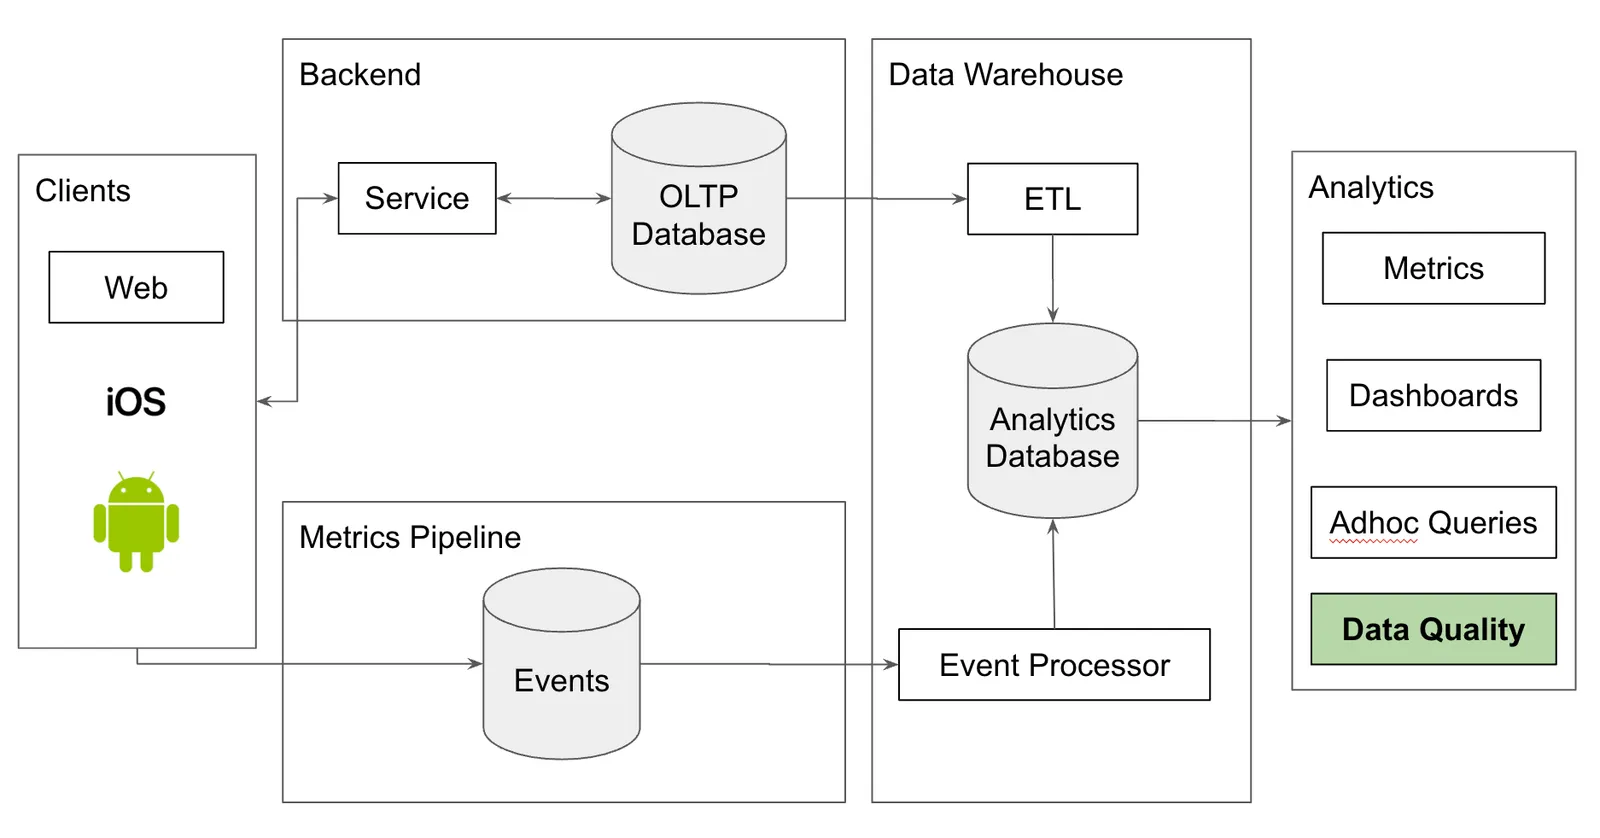
The first thing most organizations have is a software application. Pictured below, you have the standard service oriented architecture: a client, a service and a database.
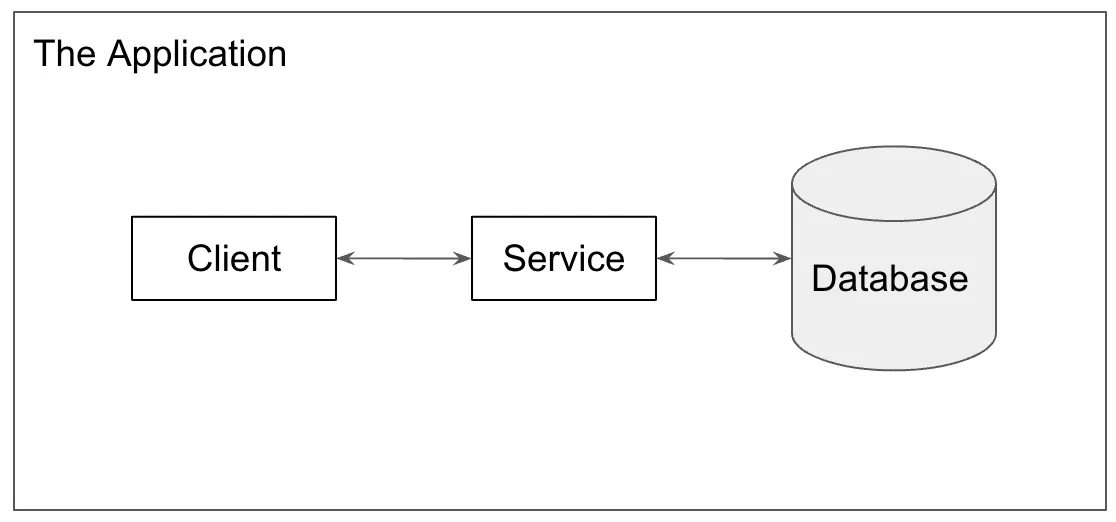
This application is the source of value within your organization. It is what customers use. That also makes it the primary source of data in your organization. Data quality issues only show up as bugs in your production application. You fix these using standard software development tools.
The Metrics Email#
At every company I’ve worked at, some pointy-haired management type (usually me) asks, “How many people are using this thing anyway?” and the daily metrics email is born. In its simplest form, a worker job is added to our stack that reads from the database and sends an email on usage statistics. Sometimes schema changes to the database are required, like a last_login field in the users table so we can calculate daily active users.
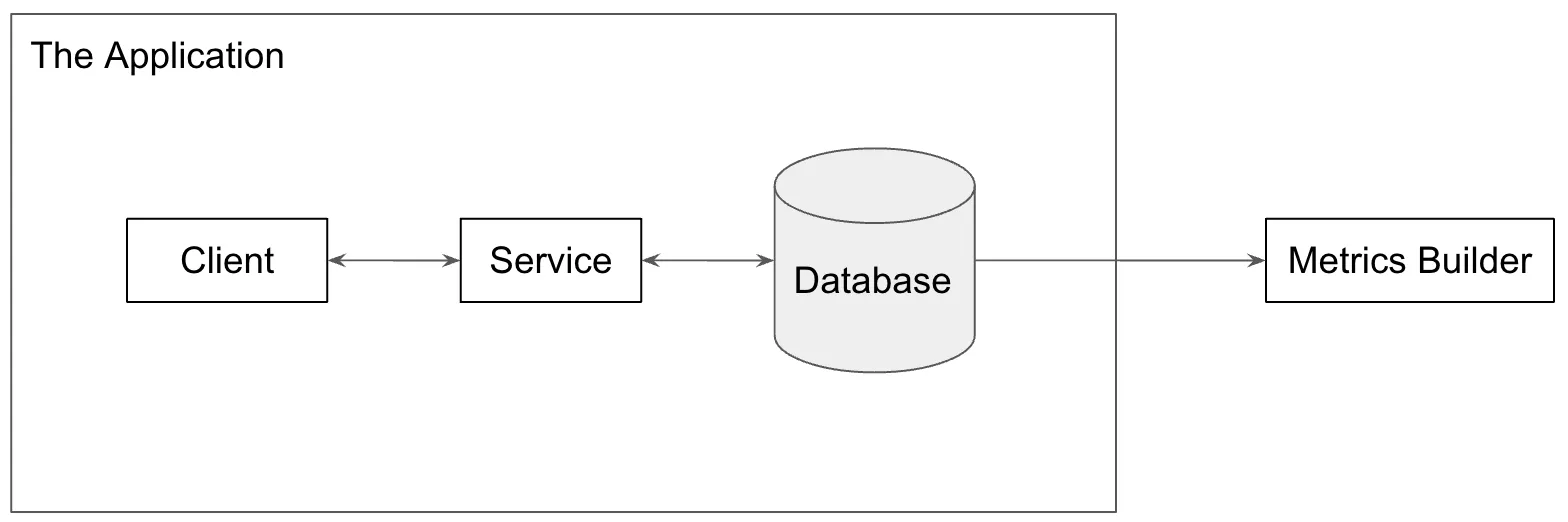
Your data now has a second customer. If the metrics email has data quality issues, pointy-haired management type notices and you have to figure out why.
Client Events#
Metrics emails reading from a database work well for a while but soon, if things are going well, you start to get multiple clients connecting to the same backend, so you start adding that additional logging to your application.
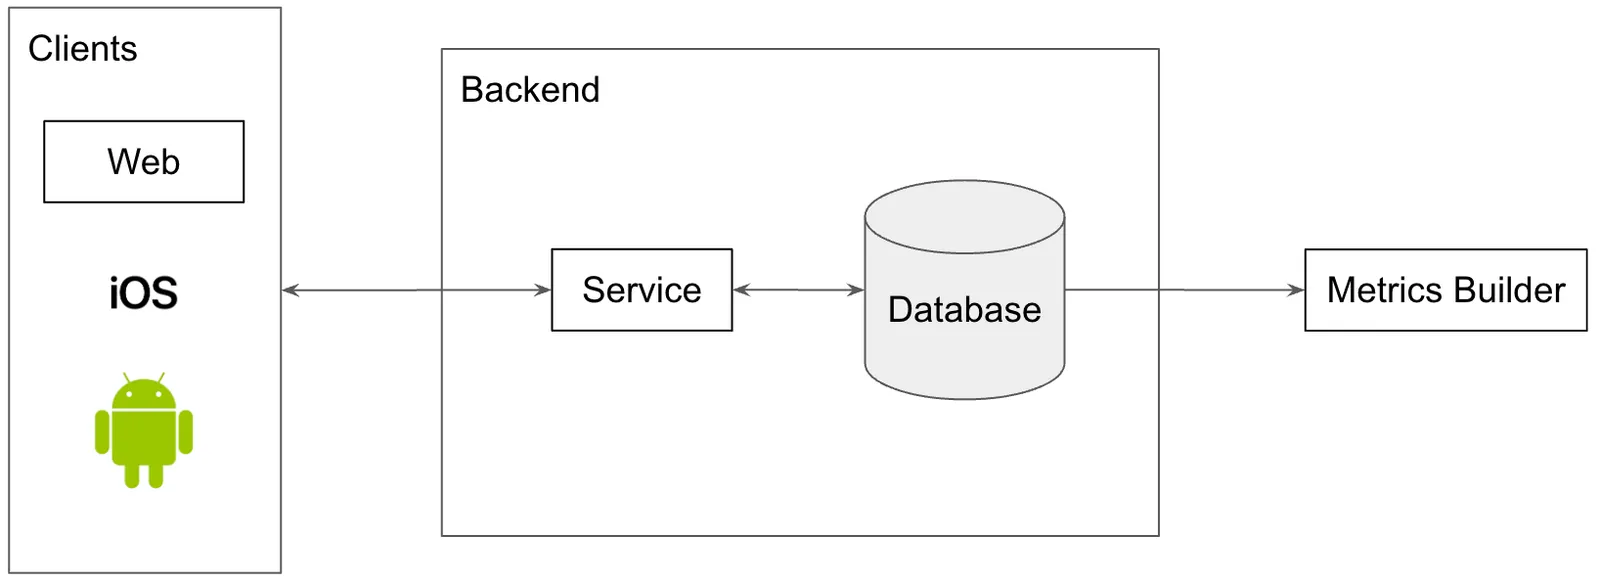
You also have the pointy haired management type asking what people are doing in the application. Are they using this feature or that feature? For some features, you can get this data from the database but for others you need to start logging client events.

So, you add another system to collect client events. This is usually shipped in the form of time series logs coming directly from the client to some additional service, labeled “Metrics Pipeline” in our diagram below. Making your metrics pipeline a separate service allows you to do clever things like prioritize real user network requests over metrics network requests.
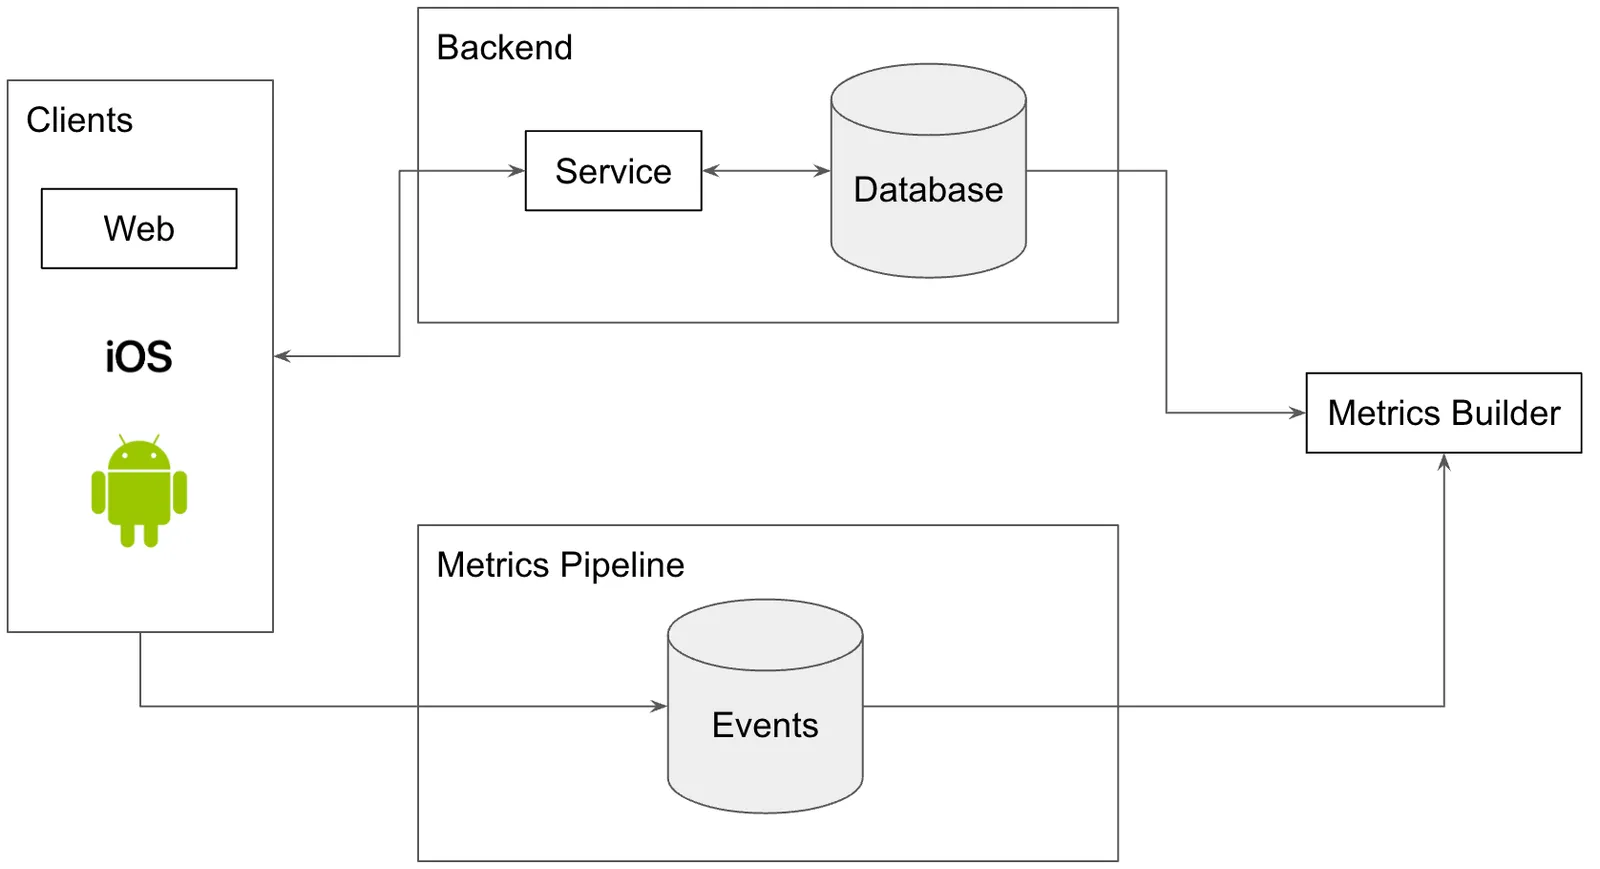
But now, you have two sources of truth for common metrics like active users. The server side metrics say you had 10 users yesterday while the client metrics say you had 11. Which is right? How do you reconcile? Welcome to data quality land. There is no way out.
Scaling: The Warehouse, Lake, Lakehouse#
Now, if you’re lucky, you’ll start to get more data than you can reasonably handle with the above architecture. The first problem you’ll run into is that your nightly metrics queries against the production database will start slowing real user queries down. You can scale up a metrics read replica but eventually, you will bite the bullet and spin up an analytics database.
Analytics databases are a totally different category than the database you use to back your application. An application database is an “Online Transaction Processing” (OLTP) database, like Postgres or MySQL. An analytics database is an “Online Analytical Processing” (OLAP) database, like Snowflake, Google BigQuery, or Amazon Redshift.
There’s a move to having a more fluid form of data warehouse called a data lake. This approach replaces the single warehouse with a namespaced set of files in an analytics friendly format stored in cloud storage. You replace the above technologies with Apache Parquet and Apache Hadoop. The main benefit of the lake approach is it lets you consume your raw client metrics instead of converting those into warehouse format so you save some duplication.
A Data Lakehouse is a combination of a Data Warehouse and a Data Lake, useful if you want both structured and semi-structured data in your system.
Now in order to get data into your warehouse or lake, you need some additional software. From your production application, you need a way to get data out of your production database and put it in the warehouse. The common term for this is Extract, Transform, Load (ETL). That is the most common approach but there are also slightly different variants like Extract, Load, Transform (ELT) and Change Data Capture (CDC).
From your metrics pipeline you need a slightly different piece of software, something that takes time series logs and puts them in warehouse format.
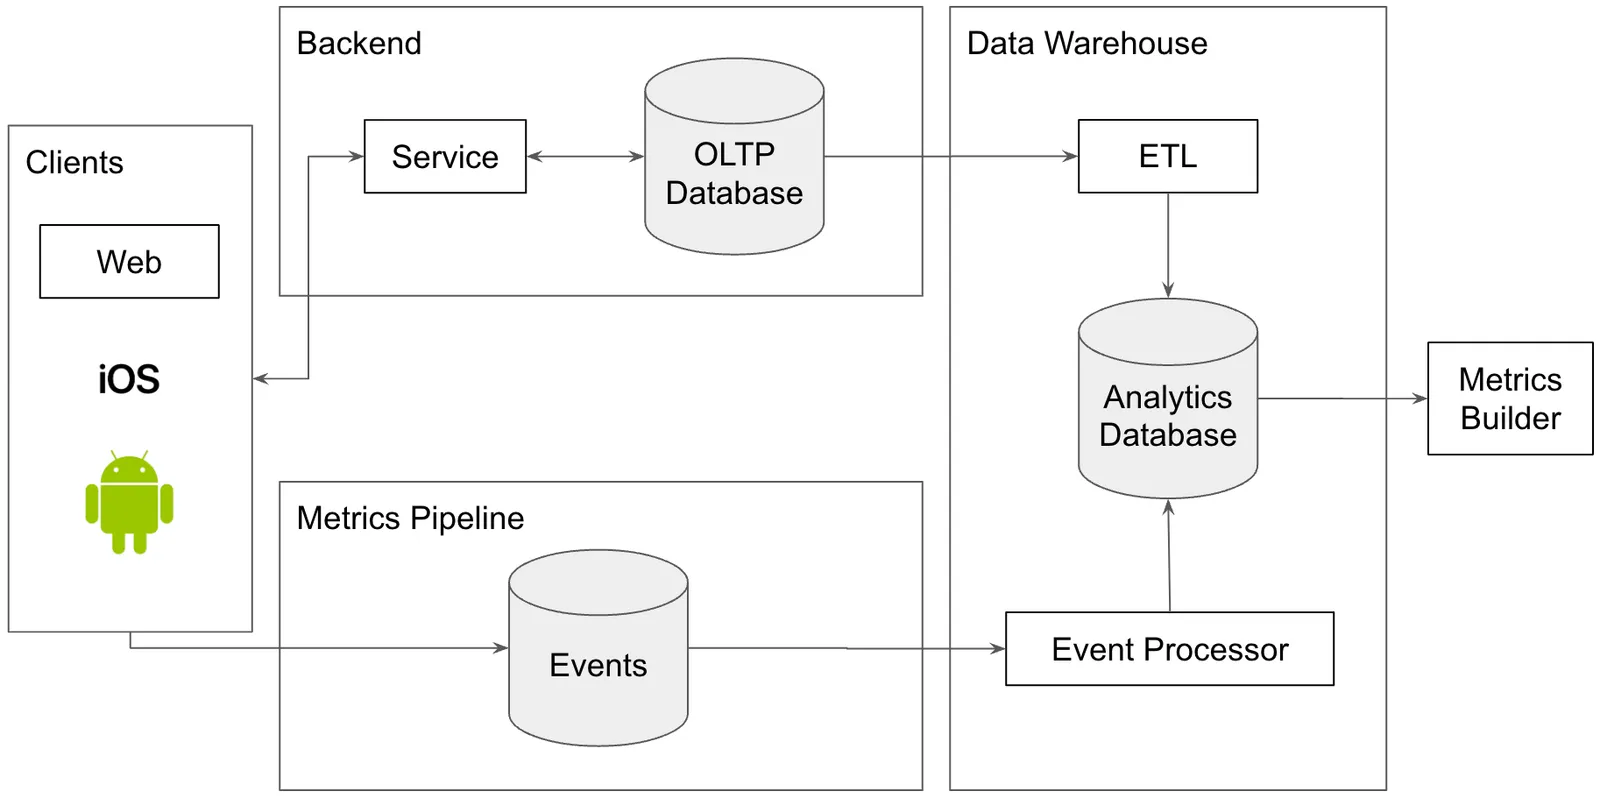
As you can see this is starting to get a little complicated. You are still having data quality issues related to reconciliation but now you have six systems instead of three where errors can be introduced. You have data duplication across your production system and your warehouse. If data needs to be fixed it needs to be fixed in multiple places. Moreover, the different systems have different purposes so what is right for metrics might be wrong for production and vice versa. There’s also lots of data. Some processing of some client events log errored out and your metrics are wrong. Did you notice? How do you find out which one? How do you re-run processing without making things worse?
Dashboards#
In the above picture you only have a limited set of canonical metrics you publish. This makes the scope of data quality limited to those metrics. But pointy haired management type is back and now he has specific questions. Why were users so low last Tuesday?
So, you add some analytics tools to your stack. You add custom dashboards or a tool like Looker that allows any user to create a dashboard with a few clicks. You give some data analysts or data scientists adhoc query access to the warehouse.
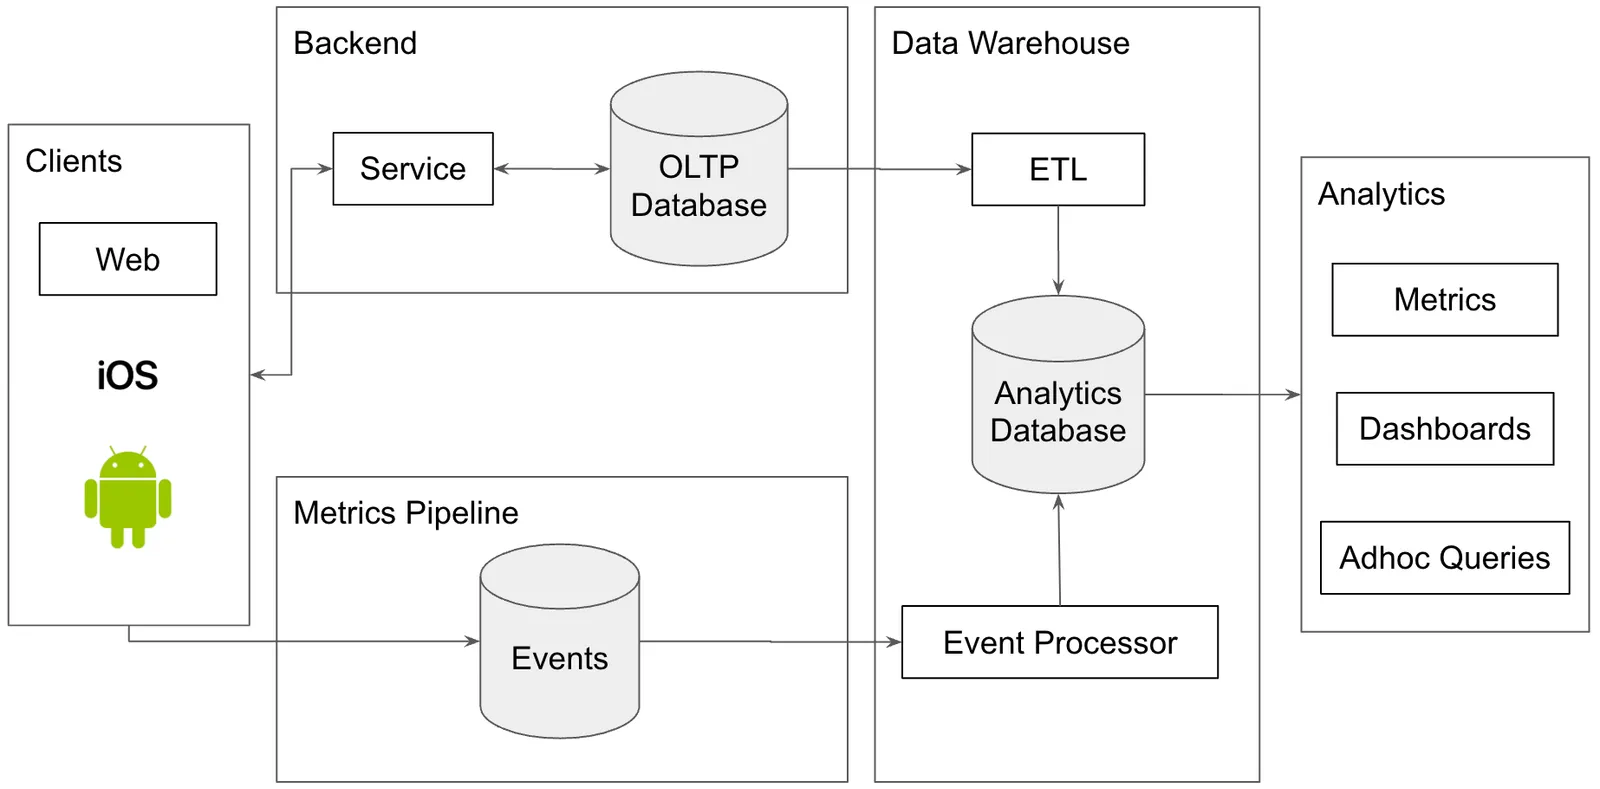
Now, the space of metrics where data quality matters explodes by 10-100X. All of a sudden someone is looking at user_sign_in and asking what the difference is between that and user_signed_in? Also, the people reading these reports are people in finance and they are very troubled that none of the numbers line up. In accounting, numbers always reconcile. In the data pipeline, you can’t even be sure how many people used the damn thing yesterday. This is a data quality problem.
Other Systems: Payments, Sales, Finance, Human Resources#
This is where the pictures stop because it starts to get a bit too complicated.
The next step in your data journey is adding data mastered in other systems into your data warehouse or analytics stack. You are using Stripe for Payments. The Sales team uses Salesforce to track leads and conversions. Customer Service uses Zendesk to support customers.
All of this data needs to be used by analytics to figure out what’s going on in your company. Is a customer who hasn’t paid their monthly bill and not in contact with customer support more likely to churn? What if sales proactively reached out to them?
You can run ETL style jobs from these systems to get the data into your data warehouse. Or you can have your analytics software consume the data from the tool’s APIs. Your approach will vary by tool and the analytics function’s needs.
The data quality issue that is introduced at this stage is usually matching related. How can I tell which data is the same across all these systems? All the data is keyed differently. You can attempt to solve this problem at ETL time or leave the problem for the analytics function.
Bespoke and External Data#
Lastly, you’ll start to have business problems that may require additional data to be solved. You’ll either have to create this data or get it from external sources. When a customer is within 100 feet of our store, is advertising more effective? What’s the business email of this user’s personal email? People who work at company X are more likely to become customers.
You might also need to start feeding processed analytics data back into your production systems, usually in the form of models. Instead of your data pipeline being unidirectional, analytics data is feeding back into production.
Search is the classic forum for these sort of use cases. With better Machine Learning tools, use cases on top of search use analytics data in production.
You now have a new class of data quality issues. How do you create quality data in house? If you buy data, how do you know it’s good? When external data gets updated and it’s wrong, what do you do? A customer is complaining about search results, how do I diagnose what’s wrong? If my model says this is the top search result but I use user clicks to generate my search results, how do I run experiments to get unbiased data?
Don’t worry, you are not alone in data quality land. Send this article to your pointy haired boss or finance so they believe you aren’t incompetent.
Data Quality Model#
Now that you have a good understanding of the modern data stack and how it evolves, I will present a model for thinking about data quality.
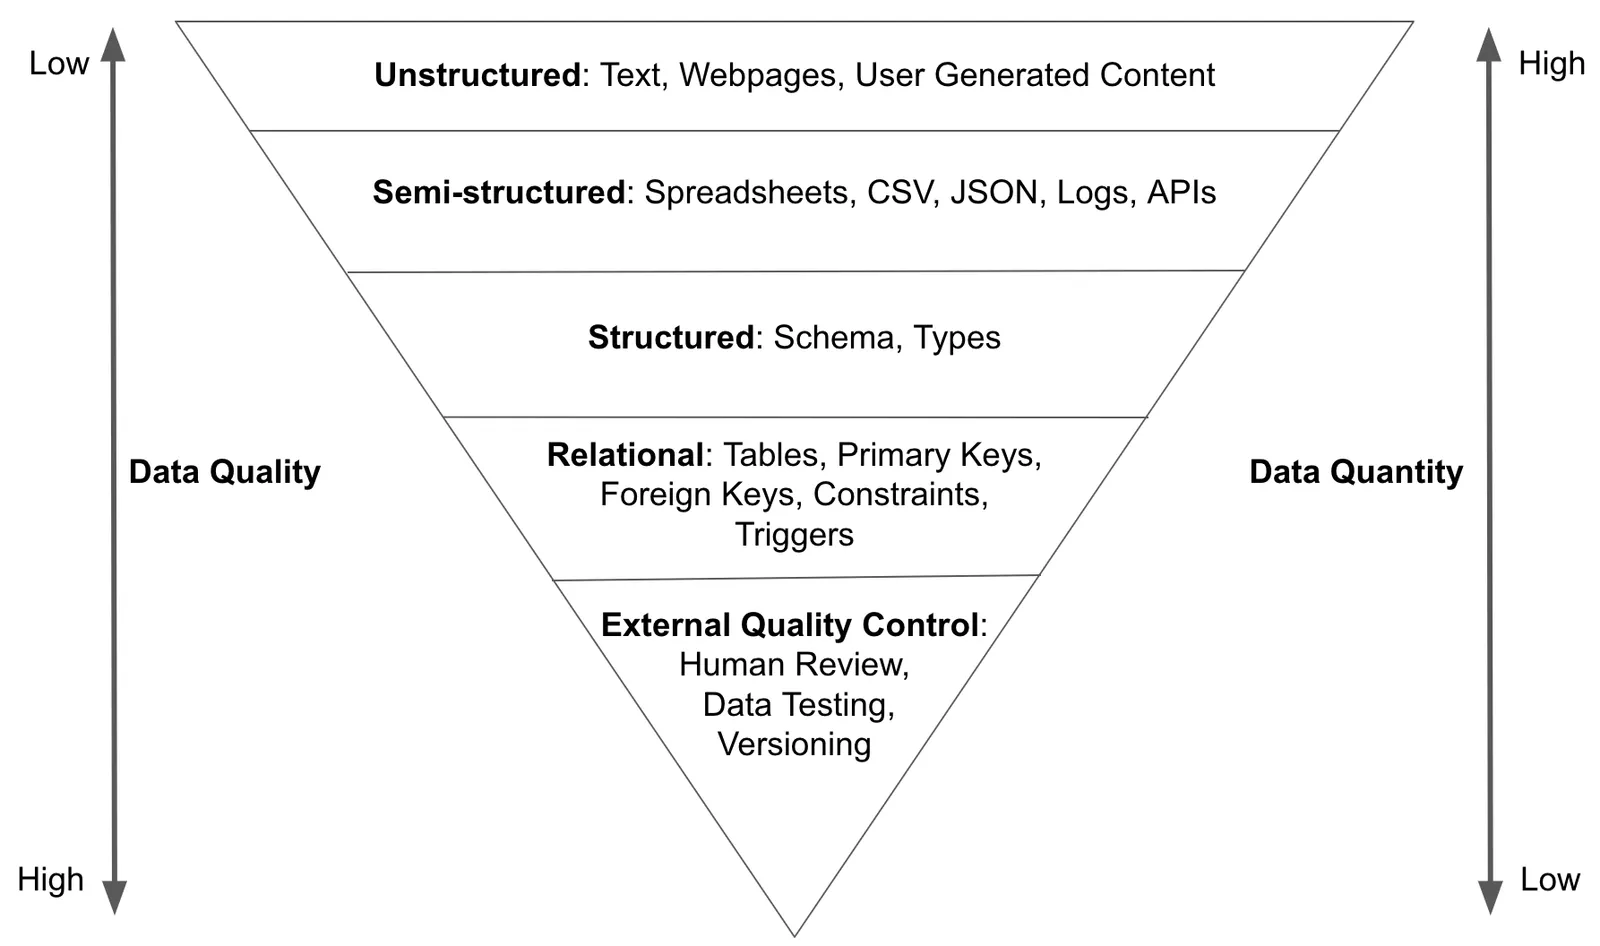
This model divides data into quality levels based on its classification. The further you travel down the inverted pyramid the higher quality the data. Each level adds additional constraints to the data ensuring data quality. Each level also requires more work, either by humans or software, reducing data quantity. You want most humans consuming data in the form of metrics or dashboards from the human reviewed portion of the data pyramid.
High quality data takes effort. You can make unstructured data semi-structured data by doing work. You can make semi-structured data structured data by doing work. And so on. If you believe in the “Data is oil” analogy, improving data quality in this manner is refining.
Unstructured Data#
![]()
In our modern data stack, unstructured data is usually user generated content: profile pictures, customer support emails, and product reviews. Sometimes this data has structured metadata attached to it.
Traditionally, this data has been largely ignored beyond displaying it to the user or manual analysis. Manual analysis in this case could be reading a sample of 100 customer reviews. To refine this data you often needed fragile “scrapers” that require constant maintenance. Or you would need to pay people to annotate the data using a labeling service like scale.ai or AWS Mechanical Turk.
Lately, refining this data has become the domain of modern machine learning tools. Many more options for refining this data exist: sentiment analysis on customer reviews, object recognition in images, automated captioning of video. This machine learning is built on the back of previous labeling efforts refining this data into structured data, training a model to do that task, and then using that model to generate more structured data.
Semi-structured Data#
![]()
Semi-structured data is machine readable. It has a common format or structure. However, it lacks a schema. A string can show up in a place where you expect a number.
In the case of spreadsheets or CSVs, this data is usually made for human consumption. The data is deemed valuable in some way and you want to ingest it into your data stack to combine it with other data. In the case of JSON or logs, the data is usually machine generated and it’s convenient for the system generating the data to have a flexible schema. Sometimes the data is exhaust from the system and it’s inconvenient to do anything but spew it to disk.
In the modern data stack, client metrics usually are in log or JSON form. This allows application developers to add new events without changing the service interface. The data is also usually large scale and log style data works best in that case. Data from APIs is also usually semi-structured in the form of JSON responses.
Most databases have CSV or JSON import functionality built in. In one off cases, you make a schema and import the data. For logs, you have a parser convert the data to structured format. This process becomes more complicated when you have repeated ingestion. What happens when the schema changes? How do you handle values you’ve already ingested changing? Converting semi-structured data to structured data becomes a critical software component in your data pipeline. This process is often the source of data quality issues.
Structured Data#
![]()
Structured data has a schema and all the data conforms to the schema. Usually, structured data enforces types in the format so it is impossible to have a string value where you expect a number, for instance. Structured data is usually in a database. I’m leaving room here for NoSQL databases.
There has been an attempt to turn semi-structured data into structured data using data dictionaries. Data dictionaries are a good idea in theory. Let’s have data to describe the data. In practice, because the rules defined in the data dictionary are not enforced in schema, you have an additional thing to maintain. Inevitably, there is drift between the dictionary and the data and you have a new set of quality issues. If you use a data dictionary, it is best to have the rules enforced by some sort of programmatic testing tool.
In the modern data stack, structured data comes from your application database. It’s a little easier to work with than unstructured or semi-structured data, leading to fewer data quality issues. However, you often have to transform the data to make it useful for analytics. This transformation can be the source of data quality issues.
Relational Data#
![]()
Relational data is structured in tables. Primary keys are used to identify rows. Foreign keys are used define relationships between tables. Constraints and triggers are used to further restrict the valid values in a particular cell. From a data quality perspective, you’re leveraging a lot of tools to ensure bad data does not get persisted. Relational data is also the easiest to query so data analysts generally want to consume relational data.
In the modern data stack, you use relational data in your application database and your analytics database. Data in this form still has data quality issues but the issues are higher order. Why are there two columns representing the same thing but with different values? Why aren’t these two addresses the same? Why is this labeled “apple” when it’s clearly an “orange”?
External Data Quality Control#
![]()
Traditionally, external quality control had been the domain of the analysis function of your data organization. Humans produce reports or analyses using the data and uncover data quality issues in the process. They then either make a best effort patch of the data in the warehouse or try to root cause the problem in the pipeline and get it fixed in the data source.
If you’ve been in software for a while, nothing I’ve said so far should be that new or novel. All the technologies mentioned, excluding advanced Machine Learning, have been around for decades. There has been a push and pull between structured vs semi-structured data for a while, the SQL vs NoSQL debates. Fundamentally, semi-structured data is more flexible, easier to transfer, but more error prone while structured data is more controlled, harder to move, but less error prone. There is a time and place for both. If your primary concern is data quality, get as far down the pyramid as possible for your data.
Recently, there are a number of technologies being invented that borrow concepts from the software engineering discipline and apply those same concepts to that data domain: specifically, human review, data testing, and data versioning. Like with code, adding these concepts to your data can increase data quality.
We’ll cover these concepts in more depth in the tools section but practically, the ability to compare two copies of a very large table, examine what changed manually or programmatically, and then bless a copy as an immutable version can generate a step change improvement in data quality in many situations. Testing and versioning is the default in code because it increases code quality. Surely, the same would be true for data quality? We spent the past five years building one of these tools so we’re a little biased.
Data Quality Control Tools#
It’s time to go over tools that can help you with data quality control. I have divided these into “Traditional Data Quality Tools” and “Data Versioning and Testing” categories. Traditional data quality tools sit in your analytics function while data versioning and testing can be deployed there as well as in your data pipeline itself.
I prefer modern, do-it-yourself, open source tools over traditional closed source, enterprise tools. So, I dive a little deeper into tools fitting that profile.
Traditional Data Quality Tools#
Tools in this category are built for the analytics function in your organization. You add a data quality tool in your analytics function.
It turns out, there’s a Gartner Magic Quadrant for Data Quality Tools. It’s a who’s who of 1980s tech giants, IBM, Oracle, Tibco, and SAP. Even Microsoft is too modern to be represented here.
I dug through the marketing materials for these tools. These are usually a package of individual tools your analysts can use to clean data for reporting. There are built in matching and verification rules for common data types like addresses. You can build custom rules. There’s a graphical user interface for your analysts to use. Some talk of “advanced artificial intelligence” to clean your data. It seems like these tools sit on your analysts laptop, ingest data from warehouse queries, and clean it up for reporting. Some allow for changes to be forced back into the warehouse via some sort of controlled process.
I couldn’t really figure out what differentiates one tool from another. I’ve never worked at a company that bought these tools. The companies I’ve worked for have preferred open source, do it yourself solutions to these types of problems. But if that’s not you, my best advice is to contact the sales team for some of the products listed below and ask them what makes their product different. Get your procurement team ready to shell out six to seven figures.
| Product | Tagline |
|---|---|
| IBM InfoSphere Information Server for Data Quality | Turn your data into trusted information |
| Informatica Data Quality | Build trust fast |
| Precisely Trillium DQ | Enterprise data quality built for business |
| Data Ladder | Accurate matching without friction |
| SAS Data Management | Take charge of your data with the industry’s leading integration technology. |
| Talend Data Quality | Profile, clean, and standardize data across your systems |
| Tibco Clarity | A data preparation, profiling, and cleansing tool |
| Trifacta | Transform your data. Transform your business. |
Don’t despair if you are like me and prefer open source tools! There are intriguing options that I think deserve a full analysis.
OpenRefine#
- Tagline
- A free, open source, powerful tool for working with messy data
- Initial Release
- July 2013
- GitHub
- https://github.com/OpenRefine/OpenRefine
OpenRefine, previously Google Open Refine, is a free, open source competitor to the above tools. It allows you to load data, understand it, clean it up, reconcile it, and augment it with data coming from the web, all from a web browser and the comfort and privacy of your own computer.
Open Refine is Java-based and easy to set up for Linux, MacOS, and Windows. On other platforms, you can build from source.
OpenRefine has been around for a while. The tools above offer more features, especially integrations and automation. But if you’re looking for a tool to get started to get a feel for the power of the above tools, I recommend starting with OpenRefine.
DBT#
- Tagline
- Transforming Data. Transforming teams.
- Initial Release
- July 2016
- GitHub
- https://github.com/dbt-labs/dbt-core
DBT (or Data Build Tool) is an extremely popular tool for writing and versioning data transforms as SQL. DBT is built by DBT labs, formerly Fishtown Analytics. DBT was born from an analytics focused company looking at all these enterprise data quality tools and asking themselves, “there must be a better way?”
DBT allows analytics engineers to adopt a reusable, composable format for analytics workflows consisting of projects and models. These primitives surround core SQL so DBT feels familiar.
DBT primitives can be sequenced to build large data pipelines. Moreover, the individual formatted queries can be versioned, say in Git, and reused in a bunch of other analytics jobs. For instance someone writes the Daily Active User query as a DBT model and that model is used in a bunch of pipelines in the organization.
DBT enhances data quality through versioning and collaboration. You have a known good model for a metric, version it, and use it everywhere it’s needed. You don’t reinvent the model for every metrics request.
DBT has become extremely popular and is having a bit of a moment. If you’re looking to adopt a Git + SQL style approach on your analytics team, DBT is the tool for you.
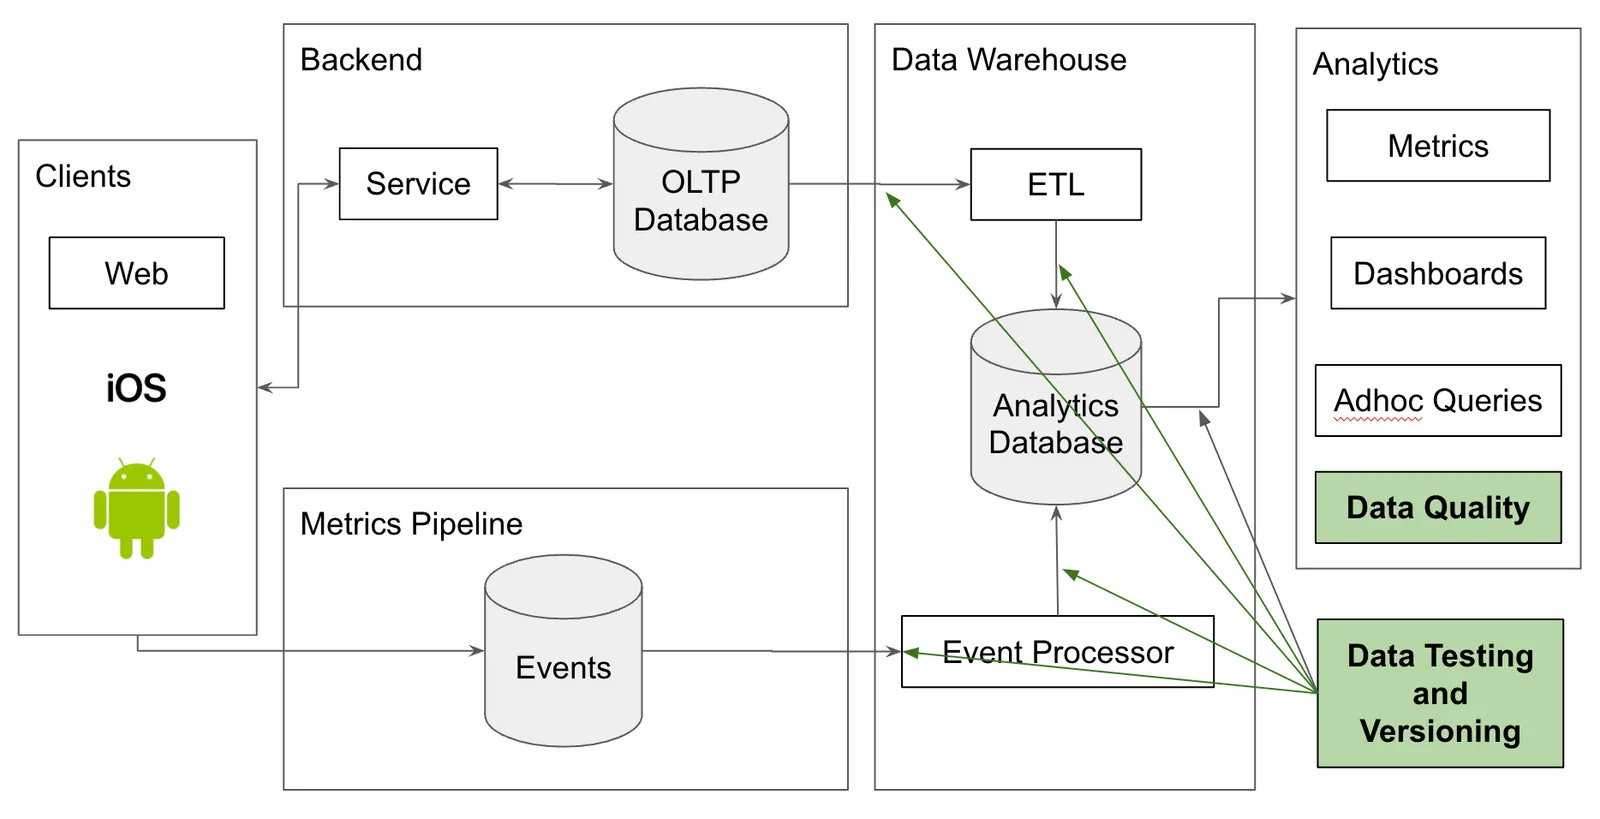
Data Testing and Versioning#
There is a new way to think about data quality control that adapts quality ideas, testing and versioning, from software development to data. These tools can be applied in your analytics function but also in your pipeline itself. Moving data quality control upstream of analytics is a powerful idea.
Just like agile software development made software development more efficient by moving software quality control closer to where code was generated, this new breed of data quality control tools allows you to move data quality control closer to where data is generated.
These tools are complementary to traditional data quality control tools. You can and should use both. These tools can be deployed in multiple places in your data stack, preferably at all the entry and exit points from your warehouse or lake.
Great Expectations#
- Tagline
- Always know what to expect from your data
- Initial Release
- Dec 2017
- GitHub
- https://github.com/great-expectations/great_expectations
Great Expectations is a data testing tool written in Python. Python is quickly becoming the standard language for working with data so most of your data team should be able to work with Great Expectations.
Great Expectations allows you to make common assertions on tabular data like expect_column_values_to_match_regex or expect_median_to_be_between. If the assertion fails, the tests do not pass. Failing tests prompt you to take action. You can layer these tests on top of standard database constraints adding additional data quality control to relational data.
Great Expectations is a radically simple idea. Write unit tests for your data. Unit tests work for code and they can work for your data as well.
The issue that you may find is what to do when your tests fail. The standard solution in software is to rollback or not publish a release. But in the data world versioning tables is not common. The next two tools look to change that.
Terminus DB#
- Tagline
- Making Data Collaboration Easy
- Initial Release
- October 2019
- GitHub
- https://github.com/terminusdb/terminusdb
TerminusDB is a version controlled graph and document database. It applies Git concepts to graph or document databases. Think Git and MongoDB/Neo4J had a baby.
The versioning syntax is exposed via TerminusDB Console or a command line interface. The versioning metaphors are similar to Git. You branch, push, and pull. See their how to documentation for more information.
Terminus fits best in the modern data stack at the gate between your metrics pipeline and your warehouse/lake. The data there is often in JSON document form and could benefit from versioning. If your tests show something awry, just rollback to the known good version.
TerminusDB is new but we like what we see. The company is very responsive, has an active Discord, and is well funded.
Dolt#
- Tagline
- It's Git for Data
- Initial Release
- August 2019
- GitHub
- https://github.com/dolthub/dolt
Dolt is the first and only version controlled SQL database. Dolt is like Git and MySQL had a baby. Dolt can be run on the command line, like Git or as a running server, like MySQL.
With Dolt, you can branch, merge, diff, and clone database tables instead of files. Is this data known good? Make a data release using a tag. Experimenting with a new data ingestion pipeline? Create a new branch and compare the results with the old pipeline using diff. Great Expectations tests fail? Rollback to the previous version.
In the modern data stack, Dolt can be used as part of your data ingestion workflows, upstream of the data warehouse. Or, Dolt can be used by your analysts downstream of the warehouse to add data quality control. Downstream of the warehouse it can also be used to share and collaborate on data using the GitHub style of collaboration, complete with Pull Requests on data, with DoltHub or DoltLab.
Dolt gives you the full quality control power of all your software development workflows in your data environment. Dolt enables next generation data quality control.
Obviously, we’re a little biased but we think the modern data stack is due for some new tools. We built one with Dolt but we also love what Terminus, Great Expectations, and DBT are doing in this space. Want to discuss? Come talk to us on Discord.