
Hello DoltLabbers! Today’s blog will be a quick-start guide, showing you how to monitor your DoltLab instance with Prometheus.
We recently released DoltLab v0.4.2 that adds support for DoltLab users requiring implicit TLS connections to their SMTP servers. It also includes some helpful debugging tools for troubleshooting SMTP server connections and querying DoltLab’s database.
Download v0.4.2 here and follow along as we launch a Prometheus server pointed at a running DoltLab instance.
TL;DR#
Here are the steps for monitoring your DoltLab instance with Prometheus:
- Open additional ports on your DoltLab host
- Run
cAdvisoron your DoltLab host - Create a Prometheus configuration file
- Run Prometheus using the configuration file
- Start querying!
Before jumping straight into the quick-start guide, it’s good to know a little bit about DoltLab’s service architecture and which services expose Prometheus metrics endpoints.
DoltLab only exposes gRPC metrics for TWO services#
For a broad overview of what services comprise DoltLab, check out this post which gives a brief overview of each one.
Here’s a list of the services:
DoltLab’s Remote API and Main API are gRPC servers written in Golang. They both have metrics endpoints that expose the default metrics provided by the Prometheus Golang Client. Currently, none of DoltLab’s other services (excluding the Proxy Server) expose Prometheus metrics. They only expose a /health endpoint, useful for simple health-check monitoring.
Because DoltLab shares source code with DoltHub, and DoltHub only exposes metrics for the two aforementioned services, DoltLab also only exposes a metrics those same two services. In this way, the two products are pretty similar.
However, DoltLab and DoltHub have very different deployment contexts. We deploy DoltHub services across multiple hosts in a Kubernetes cluster, whereas DoltLab runs on a single host via Docker Compose.
For this reason, in the case of DoltHub, we monitor the its services (including the Main API and Remote API) by exposing kubelet metrics to Prometheus. The kubelet metrics provides insights into DoltHub’s running Kubernetes resources.
But, since DoltLab uses Docker Compose, not Kubernetes, there are no kubelet metrics to expose with DoltLab. So, we’ll need another way to expose DoltLab’s container metrics to Prometheus.
Enter cAdvisor. cAdvisor publishes resource and performance metrics for running Docker containers, making it a comparable tool for monitoring DoltLab in the same way we monitor DoltHub. With that, let’s jump in to the guide 🤠!
Open additional ports on your DoltLab host: 7770, 8080, 9090
As of DoltLab v0.3.0, DoltLab’s Main API, Remote API, and Proxy Server metrics are exposed on port 7770 of your running instance. gRPC metrics for the Remote API are at :7770/doltlabremoteapi and Main API metrics are at :7770/doltlabapi. The Proxy Server’s metrics are available at :7770/stats/prometheus.
In fact, we publish each of these on our DoltLab demo instance. Check them out, respectively, here, here, and here.
To scrape your instance’s gRPC and proxy server metrics, ensure port 7770 is open on your DoltLab host.
You’ll also need to open port 8080 for publishing cAdvisor metrics as well, which will run a web UI at :8080/ and publish container metrics at :8080/metrics by default.
Finally, if you want to run your Prometheus server on the same host as DoltLab, you’ll also need to open port 9090.
Run cAdvisoron your DoltLab host
After you’ve opened the ports, you can start cAdvisor with a single command by running it as a standalone Docker container in daemon mode on your DoltLab host:
docker run -d -v /:/rootfs:ro -v /var/run:/var/run:rw -v /sys:/sys:ro -v /var/lib/docker/:/var/lib/docker:ro -v /dev/disk/:/dev/disk:ro -p 8080:8080 --name=cadvisor --privileged gcr.io/cadvisor/cadvisor:v0.39.3You can verify cAdvisor is running successfully by navigating to it’s web UI :8080/docker endpoint and seeing a list of your running DoltLab containers:
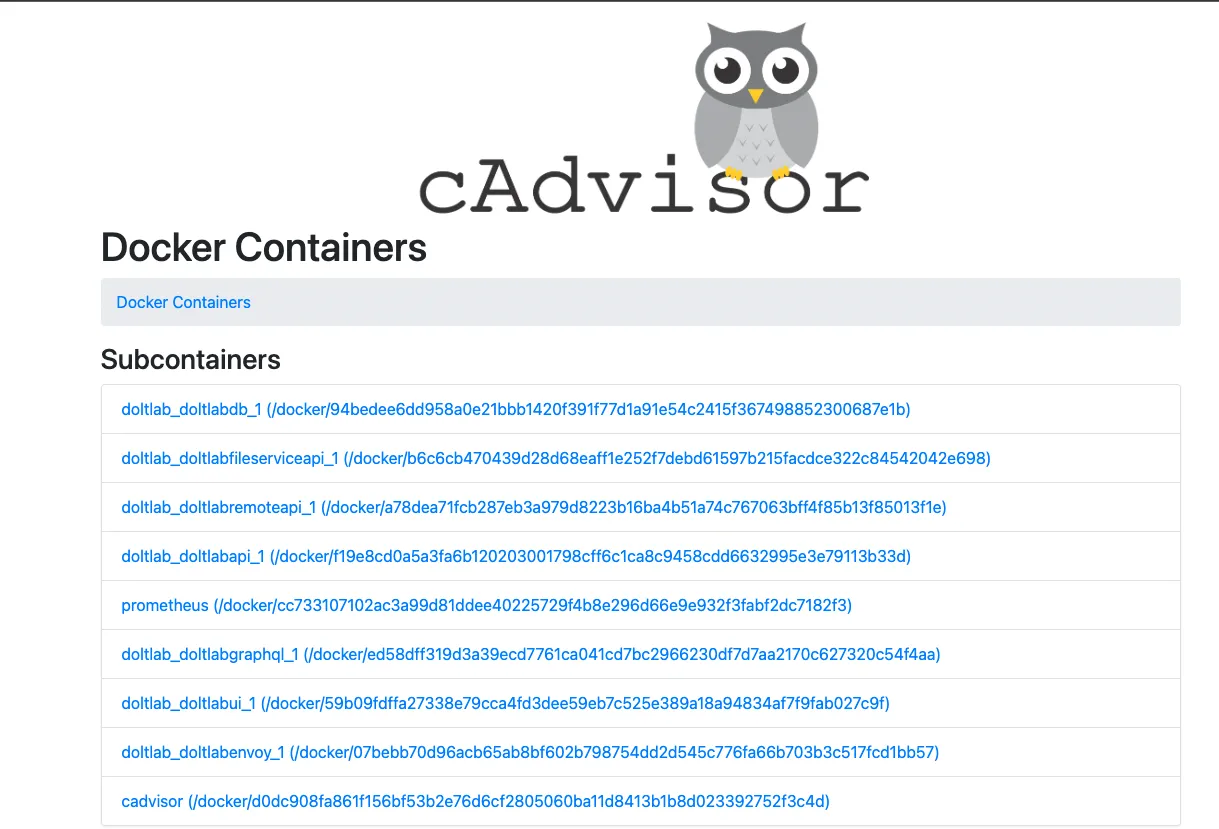
This is cAdvisor running on our DoltLab demo instance.
Create a Prometheus configuration file
Next, create a prometheus.yml file on your DoltLab host that contains the following:
global:
  scrape_interval: 5s
  evaluation_interval: 10s

scrape_configs:
  - job_name: cadivsor
    static_configs:
      - targets: ["host.docker.internal:8080"]
  - job_name: prometheus
    static_configs:
      - targets: ["localhost:9090"]
  - job_name: envoy
    metrics_path: "/stats/prometheus"
    static_configs:
      - targets: ["host.docker.internal:7770"]
  - job_name: doltlabremoteapi
    metrics_path: "/doltlabremoteapi"
    static_configs:
      - targets: ["host.docker.internal:7770"]
  - job_name: doltlabapi
    metrics_path: "/doltlabapi"
    static_configs:
      - targets: ["host.docker.internal:7770"]
By no means is it required to run your Prometheus server on your DoltLab host. If you chose not to, simply replace host.docker.internal with the hostname/IP address of your DoltLab instance. You may also omit the --add-host host.docker.internal:host-gateway argument in the the next step.
Run Prometheus
In the same directory you created the prometheus.yml file, run the following command to start prometheus as a Docker container in daemon mode:
docker run -d --add-host host.docker.internal:host-gateway --name=prometheus -p 9090:9090 -v "$(pwd)"/prometheus.yml:/etc/prometheus/prometheus.yml:ro prom/prometheus:latest --config.file=/etc/prometheus/prometheus.ymlIf successful, you can navigate to :9090/targets and view the status of the scrape targets defined in the configuration.
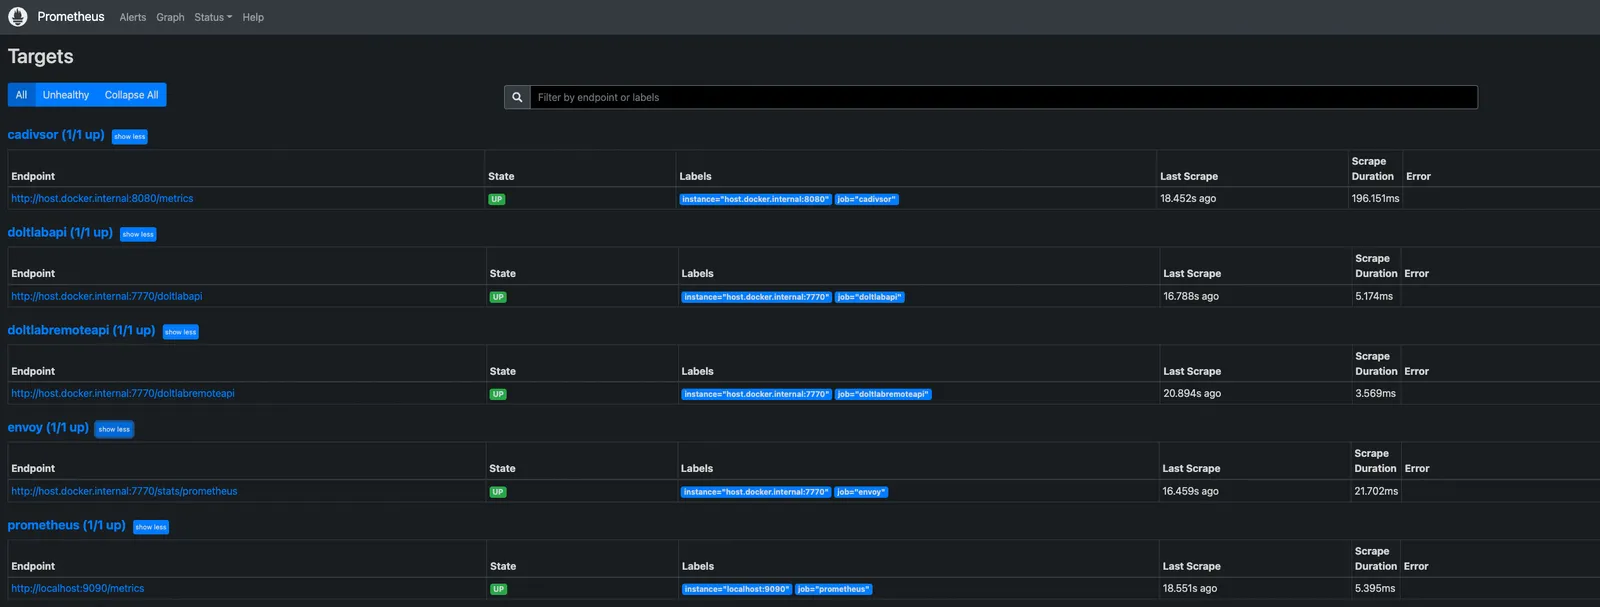
This is Prometheus running on our DoltLab demo instance.
You can now start running PromQL queries against your DoltLab instance!
Start querying!
Below I’ve included some example PromQL queries you can try. You can also follow the links below to see the executed against our DoltLab demo instance.
Memory usage per container
sum by (name) (container_memory_usage_bytes{name != ""})See this graphed against our demo instance.
DoltLab API Response Latencies by gRPC method
histogram_quantile(0.9, rate(grpc_server_handling_seconds_bucket{job="doltlabapi"}[10m]))See this graphed against our demo instance.
Not seeing anything interesting in the graph? Try running a SQL query on a demo instance’s database and see how the graph changes 🤠.
DoltLab Remote API internal server errors over last 5 minutes
rate(grpc_server_handled_total{job="doltlabremoteapi",grpc_code!="OK"}[5m])See this graphed against our demo instance.
Hopefully this is 0!
Got questions, comments, or want more information about our products?
Checkout DoltHub, DoltLab, Hosted Dolt (coming soon!), and Dolt.