
After four years of incredibly rancorous discourse about whether the US President was illegitimately elected with the help of foreign interference, it should surprise no one that the 2020 presidential election is mired in similar claims of illegitimacy. This time around, the people calling foul play aren’t blaming Russians for the outcome: they’re blaming good old fashioned election fraud of the kind that put 63 people in Chicago behind bars following the 1982 Illinois gubernatorial race. Or the 2018 fraud in North Carolina’s 9th congressional district that caused the election result to be thrown out.
But proven cases of election fraud are a lot rarer than vague allegations. Since the election, there have been a lot of vague allegations of election fraud being thrown around on social media. And like most politically motivated claims on social media, they have been widely signal-boosted without much attempt to demonstrate if they’re true or not. I saw a lot of these, and some of them actually had data sources attached to them. Being a software engineer at a data-sharing startup, I got curious. I decided to dig into a specific claim and see for myself if there might be any truth to it.
Publication day update: I saw another claim about Pennsylvania’s mail-in ballots this morning, and checked it out. Unlike the first claim, this one is corroborated by the data provided by the Pennsylvania Department of State. Skip to this update.
Update 2020-11-23: The Pennsylvania Department of state has made this data private, effectively removing it from the web. I discuss why this was a bad idea, and how data distribution tools should make it impossible to retract published open data in this manner, in a new update.
Too many elderly voters in Pennsylvania?#
On Friday night, I saw this (since-deleted) tweet being shared, already having collected several hundred retweets and likes.
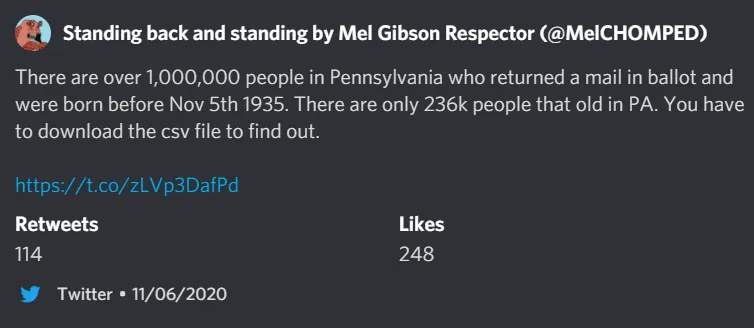
This person claims to have analyzed data on mail ballots published by the Pennsylvania Department of State, and found that over a million people over the age of 85 had returned mail-in ballots in that state. Since there are only about 230 thousand people that old in Pennsylvania, that certainly sounds fishy! So let’s get to the bottom of this. I downloaded the PA ballot data as a CSV file and got to work.
Importing the data into Dolt#
Dolt is Git for Data. It’s a SQL database that you can branch, merge, clone, fork, push and pull, just like files in Git. It also comes with a built-in SQL engine to run queries against the data that you store in it. The query I wanted to write was very simple:
select count(*) from pa
    where date_of_birth < '1935-11-05'
    and ballot_returned_date is not null;
But to write that query, I had to import the data first. Anyone who has ever worked with data knows this is much harder than it should be.
To start, I had to give the data a primary key, which is currently required by Dolt (although we’re working on fixing that). The easiest way to do this was with a quick and dirty perl script:
my $i = 0;
while (<>) {
    print "$i,";
    print $_;
    $i++;
}
The script just puts an incrementing integer ID onto the front of every row in the CSV file it’s given. I ran it like so:
% perl id.pl \
    < 2020_General_Election_Mail_Ballot_Requests_Department_of_State.csv
    > 2020_pa.csv
This gives me a schema that Dolt can import. To automate its creation,
I tried to use the dolt schema import command to divine it
automatically, which would save me a lot of typing. Unfortunately, it
thought that all the date columns were actually just strings.
% dolt schema import -c --pks="id" pa 2020_pa.csv
CREATE TABLE `pa` (
  `County_Name` longtext NOT NULL,
  `Applicant_Party_Designation` longtext NOT NULL,
  `Date_of_Birth` longtext NOT NULL,
  `Mail_Application_Type` longtext NOT NULL,
  `Application_Approved_Date` longtext NOT NULL,
  `Application_Return_Date` longtext NOT NULL,
  `Ballot_Mailed_Date` longtext NOT NULL,
  `Ballot_Returned_Date` longtext NOT NULL,
  `State_House_District` longtext NOT NULL,
  `State_Senate_District` longtext NOT NULL,
  `Congressional_District` longtext NOT NULL,
  PRIMARY KEY (`id`)
) ENGINE=InnoDB DEFAULT CHARSET=utf8mb4;
This is because all the dates provided by the Pennsylvania Department
of State were formatted in that peculiar American style that much of
the software in the world just refuses to work with: MM/DD/YYYY.
(Note that as crazy as America is in this decision, Canada manages to be even worse somehow)
So I had to modify this schema by hand to change the types, and to change the nullability of these columns. Not a huge deal. But of course, importing the data failed for the same reason.
% dolt table import -u pa 2020_pa.csv
Rows Processed: 0, Additions: 0, Modifications: 0, Had No Effect: 0
A bad row was encountered while moving data.
Bad Row:County_Name:"ADAMS" | Applicant_Party_Designation:"R" | Date_of_Birth:"08/31/2000" | Mail_Application_Type:"OLREGV" | Application_Approved_Date:"09/26/2020" | Application_Return_Date:"09/26/2020" | Ballot_Mailed_Date:"10/03/2020" | Ballot_Returned_Date:nil | State_House_District:"91ST LEGISLATIVE DISTRICT" | State_Senate_District:"33RD SENATORIAL DISTRICT" | Congressional_District:"13TH CONGRESSIONAL DISTRICT"
value "09/26/2020" can't be converted to time.Time
These can be ignored using the '--continue'
But being a software engineer on the open-source project you’re trying to use has its advantages: I knew right where to change the code to make the date processing logic more forgiving. I also filed an issue to fix this for everybody.
With those changes, my import finally completed successfully.
% dolt table import -u pa 2020_pa.csv
Rows Processed: 3098705, Additions: 3098705, Modifications: 0, Had No Effect: 0
Import completed successfully.
Finally, I could run my query!
Conclusion: the dead didn’t steal the election in Pennsylvania#
pa_voters> select count(*) from pa
    where date_of_birth < '1935-11-05'
    and ballot_returned_date is not null;
+----------+
| COUNT(*) |
+----------+
| 126766   |
+----------+
So it turns out: a million extremely elderly people did not return mail-in ballots in Pennsylvania. About 126,000 did. This is a turnout of around 50% for this age bracket, totally plausible (and actually kind of low for this year).
Deboonked!

Discussion: what went wrong?#
So what gives? It’s easy to come up with explanations for why so many people accepted this wild claim at face value. But what about the person propagating it? Were they simply lying?
I don’t think so. The tweet has since been deleted so I can’t demonstrate it, but the poster seemed sincere in his analysis. He just got it wrong. And from what I could tell, a big reason he got it wrong is that he used Excel to import and analyze a 446MB, 3 million row CSV file.
Excel is an amazing piece of software, and it’s responsible for a truly mind-boggling fraction of business and data analysis workloads. But it has grown into these roles in a very haphazard and at times reluctant fashion. When you throw certain kinds or magnitudes of data at it, like a half gigabyte of text with 3 million rows, it doesn’t always work right.
Or, maybe I don’t know what I’m talking about and it did work right! Maybe the guy just sorted the spreadsheet by date of birth, it worked perfectly, and he read the row number wrong. But my claim is that it doesn’t actually matter. The point is that we can never know, because the analysis he performed is not reproducible or sharable. It’s forever lost in time, like tears in the rain.

We built Dolt because we think that the way we share data on the internet is broken. We’re stuck mailing zip files of CSV files around like it’s 1975. And once you get one of these files, most of your work is still ahead of you. As a rule, it’s not easy to import non-trivial CSV data in a usable form. Industry research indicates that professional data scientists spend nearly 80% of their time finding and cleaning datasets. Eliminate this janitorial work, and every data scientist becomes five times as effective overnight.
Imagine a world where the data from the Pennsylvania Department of State was already distributed in Dolt format. Not only is the data 1/3 the size of the uncompressed CSV file, it arrives in a fully usable form: there’s no import process, no trying to figure out what the types of the columns are, whether they’re nullable, etc. You just run one command:
% dolt clone dolthub/pa_mail_ballots_2020… and you have all the data, ready to start querying immediately. If the data is updated in the future, you can get the latest copy with one more command.
% dolt pullIf I’m a budding amateur electoral fraud analyst with a hot scoop I want to share with my 4chan Pepe buddies, I can save my analysis as a query that then travels alongside the database.
% dolt sql -q \
    "select count(*) from pa where date_of_birth < '1935-11-05' and ballot_returned_date is not null;" \
    -s "PA voters over 85"
+----------+
| COUNT(*) |
+----------+
| 126766   |
+----------+
Now when my fellow election sleuths pull the database, they can verify or expand on my work with a single command:
% dolt sql -x "PA voters over 85"
Executing saved query 'PA voters over 85':
select count(*) from pa where date_of_birth < '1935-11-05' and ballot_returned_date is not null;
+----------+
| COUNT(*) |
+----------+
| 126766   |
+----------+
And of course, they can view and query the data themselves on DoltHub if they’re too lazy to download it.
Update: a new claim, this one corroborated#
This morning I saw an additional claim about Pennsylvania’s mail ballots: many of them were apparently registered as having been returned on the same day they were mailed out to the voter, or earlier in some cases.
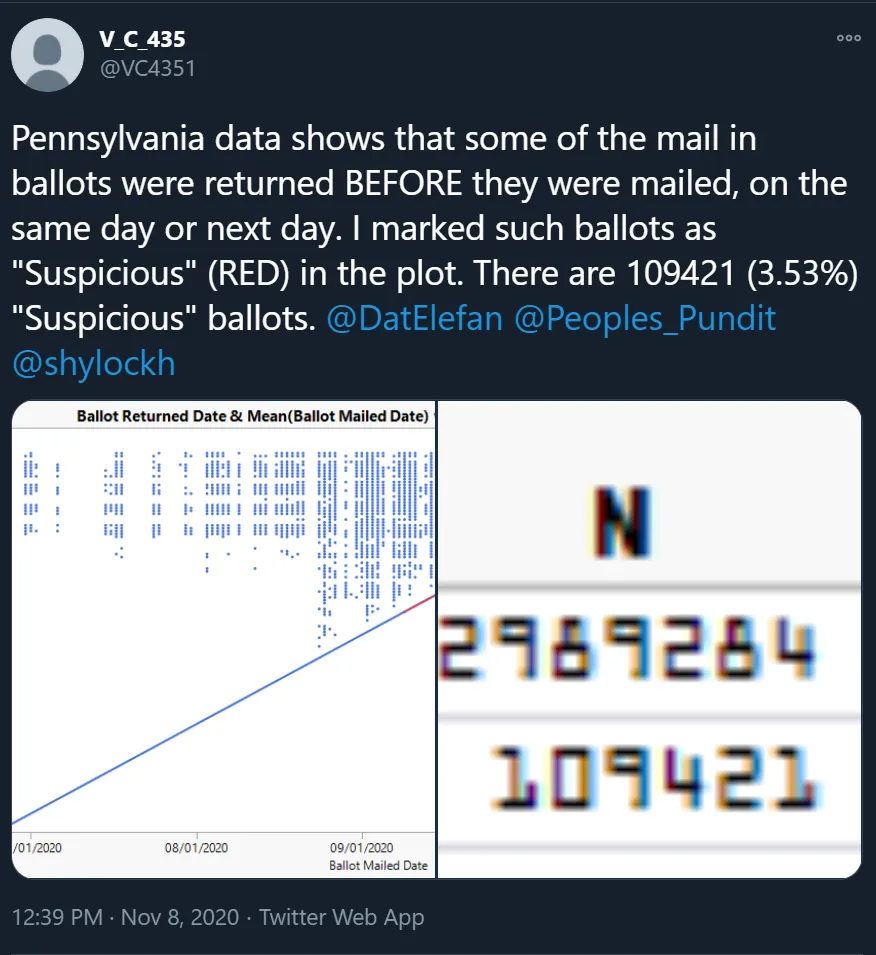
Unlike the previous claim, this one actually seems to have some merit. About 23,000 ballots in Pennsylvania are reported to have been returned before they were mailed to the voter:
pa_voters> select count(*) from pa where Ballot_Returned_date < Ballot_mailed_date;
+----------+
| COUNT(*) |
+----------+
| 23305    |
+----------+
And a great many more were returned the same day or a day later, just as the twitter thread claims. Here’s a query that measures ballot latency, counting how many ballots were returned by each day after being mailed to the voter. That is: how many ballots were returned 1 day after being mailed, 2 days after being mailed, etc. We can see the same pattern being described in the tweet.
pa_voters> select (unix_timestamp(Ballot_Returned_date) - unix_timestamp(Ballot_mailed_date)) / 86400 as days, count(*) from pa where ballot_returned_date is not null group by 1 order by 1;
+--------+----------+
| days   | COUNT(*) |
+--------+----------+
| <NULL> | 9005     |
| -125   | 1        |
| -23    | 1        |
| -21    | 4        |
| -20    | 1        |
| -19    | 2        |
| -18    | 9        |
| -17    | 22       |
| -16    | 16       |
| -15    | 3        |
| -14    | 48       |
| -13    | 28       |
| -12    | 35       |
| -11    | 65       |
| -10    | 166      |
| -9     | 11       |
| -8     | 25       |
| -7     | 374      |
| -6     | 1432     |
| -5     | 2349     |
| -4     | 2747     |
| -3     | 3833     |
| -2     | 7329     |
| -1     | 4804     |
| 0      | 34916    |
| 1      | 51200    |
| 2      | 43284    |
| 3      | 43866    |
| 4      | 40690    |
| 5      | 47332    |
| 6      | 63524    |
| 7      | 111638   |
| 8      | 119774   |
| 9      | 155236   |
| 10     | 128564   |
| 11     | 112363   |
| 12     | 108819   |
| 13     | 129311   |
| 14     | 134128   |
| 15     | 83533    |
| 16     | 104865   |
| 17     | 112519   |
| 18     | 79459    |
| 19     | 80475    |
| 20     | 71984    |
| 21     | 72383    |
... <snip> ...
| 197    | 2        |
| 208    | 1        |
| 249    | 1        |
+--------+----------+
It’s possible there’s a totally benign explanation for this pattern in the data. But unlike the previous claim, this one is corroborated by the official government data and can’t be immediately dismissed.
In any case, I’ve updated the DoltHub repository with these two new analysis queries, and you can download the database to run them yourself.
2020-11-23 Update: Pennsylvania pulls the data#
As of today, the original government data on which these analyses were based is no longer available. The state has hidden it behind a login, presumably only for state employees to access.
This is a strange move. If your state’s election were embroiled in controversy and legal challenges, and the ballot data had already inspired several viral conspiracy theories, surely you would at least consider that redacting previously published “open” data about that election would inspire exactly the sort of conspiratorial thinking that you are presumably trying to discourage. But then again, maybe not. Like everything in this situation, maybe there’s a totally benign, boring, procedural reason for the state pulling the data.
But again, my point is that we shouldn’t be having this conversation in the first place. If this data had been published in the Dolt format, it would be impossible to redact once anyone had cloned or forked it. Dolt is decentralized, distributed version control for data. This means that no central authority can take down a repository, because anyone with a copy can just become the new authoritative source. And like Git, every revision of a Dolt repository has a cryptographic hash corresponding to its exact contents. This means that no one can sneakily edit the data without people noticing — anyone with a copy of the data can review its entire revision history, and if someone redacts or changes some of that history, it produces a different cryptographic hash that’s impossible to fake. It’s actually mathematically impossible. This makes Dolt ideal for open data projects. Transparency and accountability are built into the file format and protocol.
Our mirror of the Pennsylvania ballot
data
is still up. Unlike the many CSV copies of this data floating around
the internet at this point, our mirror can be verified because of the
above properties. There’s no “chain of custody” on the original CSV
file that we downloaded to create the Dolt repository (it was just a
flat file with no versioning), but anyone who cloned the data since
this original article went live can see for themselves that the
contents haven’t changed since our original upload. And if we wanted
to share further updates to this data, anyone could transparently see
what those changes were without any additional work. It’s all right
there in the version history: just type dolt pull to get the newest
data, dolt log to read a change log, and dolt diff <rev1> <rev2>
to see exactly what data changed.
At DoltHub, we think that for data to be truly open, it cannot be centralized. People in power can change or delete centralized data with no easy way for consumers of the data to know. Decentralized distribution is the only safeguard against this abuse of trust. The future of data distribution will be decentralized, just like source code is today with git and GitHub. And for decentralized data distribution and collaboration to work, you need a tool like Dolt. Try it out and see if you agree.
Conclusion#
In today’s fractured information landscape, it’s more important than ever to be able to quickly share data about controversial claims. The tools that we have for doing that today are abysmal. They’re slow, difficult to use, easy to mess up, tough to reproduce, and awkward or impossible to share and collaborate on. We built Dolt because we thought a better way to share data is possible. We think Dolt is the answer. Give it a try and see if you agree.
To run the example queries in this blog article yourself, you can clone the dataset from DoltHub here.
If you aren’t ready to download the tool or just want to ask questions, come chat with us on Discord. We’re always happy to hear from new customers!