
Overview#
In this blog post, we discuss an approach for simulating an outbreak of COVID-19 in the US Congress.
This is a long technical article about data sets, epidemiology, and simulation. Feel free to jump straight to the results of the simulation.
Introduction#
DoltHub has been tracking COVID-19 cases for several months in our coronavirus dataset. In addition to pulling in country-level aggregates from sources like Johns Hopkins, we’ve also been aggregating individual case details where available, from several different sources. Most of these case details are from government publications, but we’ve also put some less reliable, crowd-sourced reports on a non-master branch of the repository.
These case details are interesting because they allow us to break down the fatality rate of the virus by age and sex. As we’re all aware by now, COVID-19 is not kind to the elderly. But less well known is the fact that COVID-19 appears to be deadlier to men as well.
How much more deadly? Here are the raw numbers from the case details we’ve been able to collect.
doltsql> select * from mortality_rate_by_age_sex where age_range is not null and age_range > 2;
+-----------+-----+-------+--------+----------------+
| age_range | sex | cases | deaths | mortality_rate |
+-----------+-----+-------+--------+----------------+
| 3         | F   | 240   | 0      | 0              |
| 3         | M   | 306   | 2      | 0.0065359455   |
| 4         | F   | 267   | 0      | 0              |
| 4         | M   | 250   | 1      | 0.0039999983   |
| 5         | F   | 354   | 3      | 0.0084745735   |
| 5         | M   | 303   | 3      | 0.009900987    |
| 6         | F   | 239   | 1      | 0.0041840984   |
| 6         | M   | 248   | 7      | 0.028225794    |
| 7         | F   | 109   | 4      | 0.036697213    |
| 7         | M   | 123   | 6      | 0.04878045     |
| 8         | F   | 64    | 2      | 0.031249952    |
| 8         | M   | 37    | 5      | 0.13513477     |
| 9         | F   | 15    | 0      | 0              |
| 9         | M   | 4     | 1      | 0.24999376     |
| 10        | F   | 1     | 0      | 0              |
+-----------+-----+-------+--------+----------------+
Each age_range is a decade corresponding to the patient’s age, so
that for example 7 corresponds to patients 70-79 years old. As you can
see, the disease is much deadlier for older people, but especially for
older men. In Italy so far, COVID-19 is almost twice as deadly to men
as to
women.
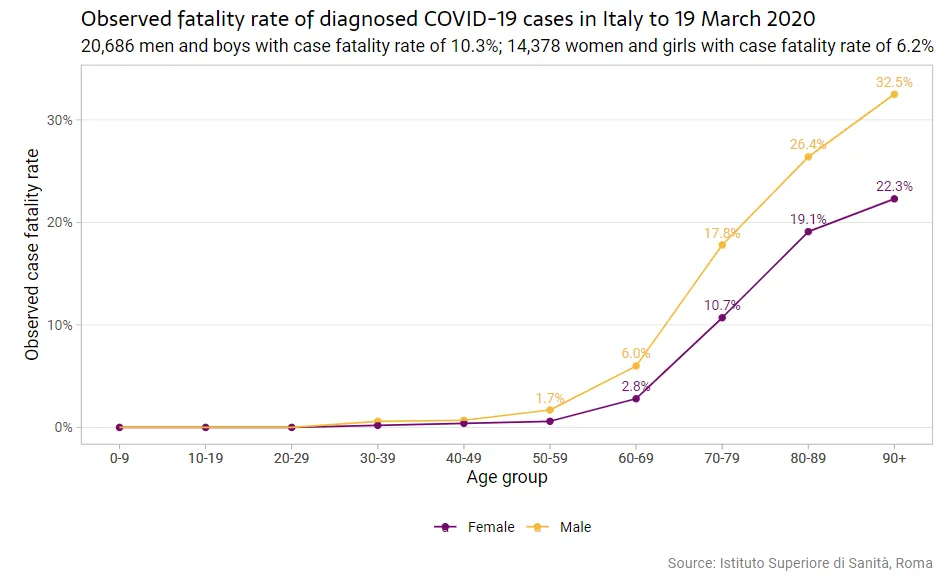
It’s also worth pointing out how much worse this disease seems to be for men. Of the deaths in Italy at the time of this bulletin, 71% were men. Of diagnosed cases, 59% were male (more than 200 Italian boys have the illness but none had died at the time of the bulletin). There were more male fatalities aged 80 and over than female of all ages. Also, it’s worth pointing out that while it is definitely worse for older people, fatality rates are pretty bad for middle-aged people - about 1% for those between 30 and 59.
Simulating an outbreak of COVID-19 in the US Congress#
Knowing that this disease is especially unkind to older men, an obvious question to ask is what would happen if an outbreak occurred in a place dominated by older men? Such as, for example, the US Congress?
Is this in poor taste?#
This is a tricky subject to discuss. On the one hand, speculating about who might die in a pandemic is just ghoulish and morbid no matter how you approach it. This isn’t a game, and it’s in poor taste to discuss it like it is. On the other hand, this exercise isn’t just an idle thought experiment. One US Senator and two members of the House have already been diagnosed with COVID-19. It’s likely that others will follow in the coming days and weeks.
More importantly, our legislative representatives are currently drafting and debating legislation about the national response to the pandemic that will affect the lives of hundreds of millions of Americans. For many thousands of Americans, their decisions are literally a matter of life and death. It’s important that we and they understand exactly the risk this disease poses to Americans, especially older Americans, even if talking about it makes us uncomfortable. Even with the best medical care available, the outlook for older people with COVID-19 is grim, and it’s important that our legislators understand that they, personally, are at great risk. We are all counting on them to make sensible policy choices in this crucial time. They have skin in the game. We will quantify how much.
Simulation parameters#
The simulation we will run depends on three inputs:
-
The age and sex of the legislative representatives. Both of these factors are important predictors of mortality.
-
The percentage of the population that gets infected. Estimates for how many people in an immunologically naive population are infected by a new disease range up to around 80% by Imperial College of London. How the population reacts matters: different behaviors (such as social distancing) can reduce this number dramatically.
-
The mortality of the disease for each age bracket and sex. As we will see, there are multiple competing estimates for this information.
The first input is the independent variable in our simulation. We’ll vary the second two inputs to give us an idea how an outbreak might play out under different circumstances.
Congressional demographics#
We obtained these from Wikipedia’s pages on the Senate and the House of Representatives. We wrote some quick and dirty Perl scripts to parse the text, then imported the results into Dolt. You can browse them in our us-congress dataset online. Wikipedia doesn’t include entries on the sex of members of Congress, so we keyed these by hand. (After doing all this work, we discovered ProPublica’s congress dataset, which would have been much easier to use. Live and learn. Further updates to our US Congress dataset will come from ProPublica.)
Our current Congress is very old. All Congresses tend to be relatively old compared to the general population, but ours is one of the oldest. Here are the oldest members of the Senate:
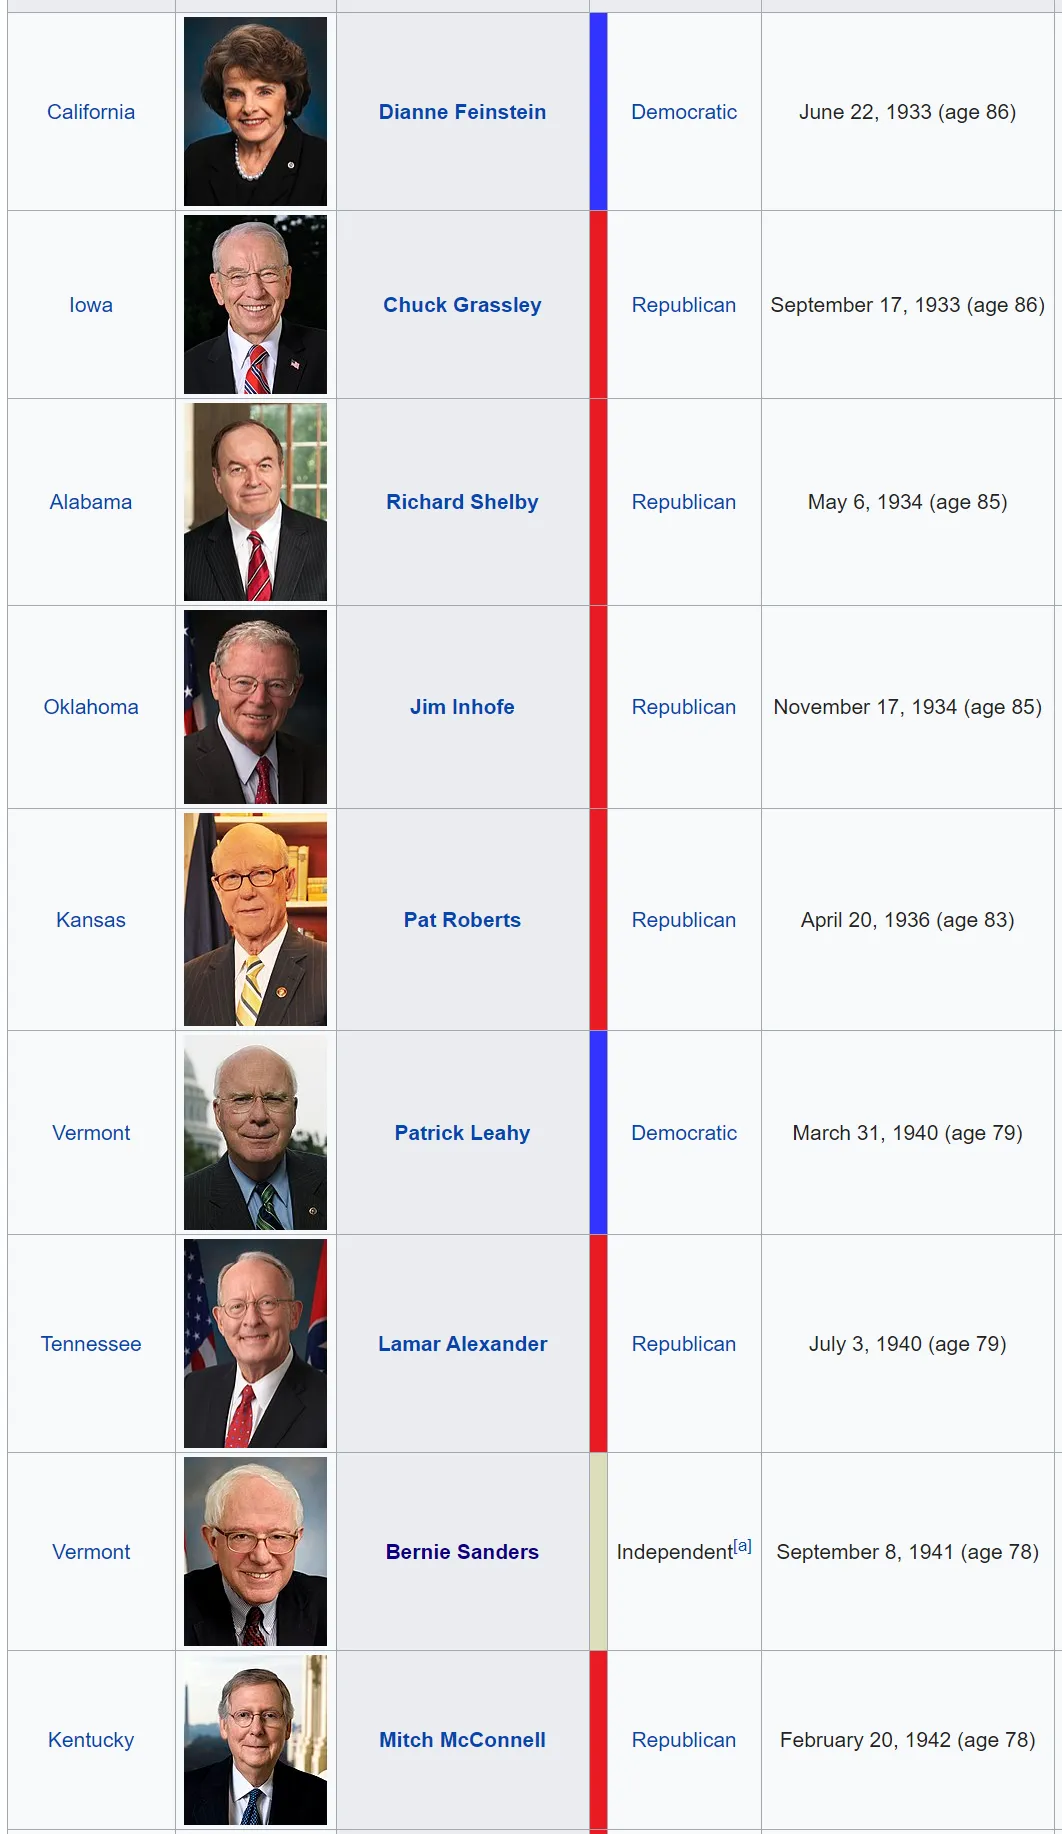
Not only is Congress old, it’s also very male. Here’s how male:
doltsql> select sex, count(*) from senate group by 1;
+-----+----------+
| sex | COUNT(*) |
+-----+----------+
| M   | 74       |
| F   | 26       |
+-----+----------+
doltsql> select sex, count(*) from house group by 1;
+-----+----------+
| sex | COUNT(*) |
+-----+----------+
| M   | 329      |
| F   | 101      |
+-----+----------+
These two factors put Congress at a much greater risk of COVID-19 than the general population they represent.
Modeling the percentage of a population who will be infected#
Pure mathematical models estimate that the virus will spread to the majority of a population before running out of new hosts. Imperial College of London predicts an 80% infection rate over the course of a COVID-19 epidemic. But public response, including social distancing, health care responses, and hygiene practices, could change this number dramatically. On the other hand, politicians might be among the most at-risk people on the planet owing to the nature of their job: frequent face-to-face interaction with many different people, as well as frequent air travel. Nearly 10% of Iran’s parliament was reportedly infected as of three weeks ago.
The truth is that no one knows just what percentage of people we should expect to become infected at this point. There are simply too many variables. To account for this uncertainty, we run our simulation three times, with three different estimates of the spread: 20%, 50%, and 80%.
Modeling the fatality rate for age and sex#
Fatality is difficult to estimate when an epidemic is in progress. COVID-19 takes weeks to kill, and new cases are growing exponentially. This means that early estimates of fatality might be low, because most cases are new, and most patients who will eventually die haven’t yet succumbed to the disease. Or it might mean that estimates are high, because only the most serious cases have been diagnosed and many milder cases aren’t on the books. Tomas Pueyo explored the difficulties in getting a good estimate for fatality in a widely-circulated Medium article earlier this month. Here’s his illustration of how the estimated fatality rate changed over time in several countries:
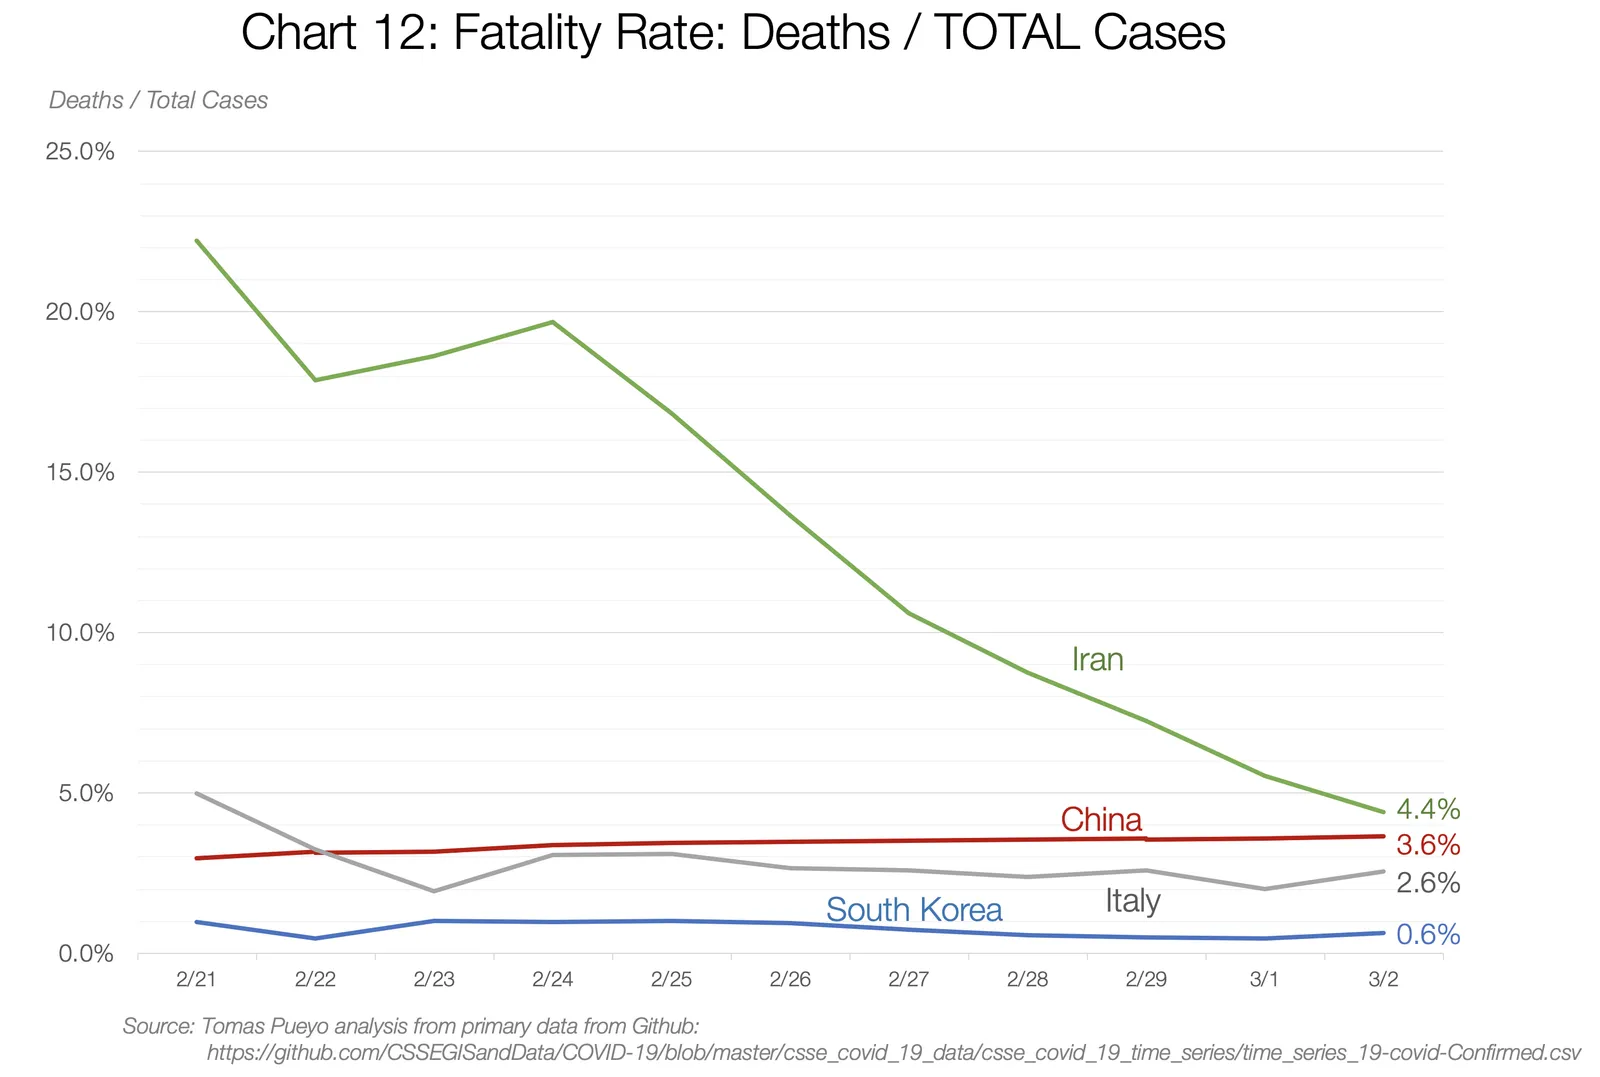
We’ve observed the same thing with our own coronavirus data. As additional cases are reported, the observed fatality rate changes. Dolt’s versioned query capabilities make this easy to see. Here are two queries on the observed fatality rate 8 days apart:
doltsql> select * from mortality_rate_by_age_sex where age_range > 2;
+-----------+-----+-------+--------+----------------+
| age_range | sex | cases | deaths | mortality_rate |
+-----------+-----+-------+--------+----------------+
| 3         | F   | 240   | 0      | 0              |
| 3         | M   | 306   | 2      | 0.0065359455   |
| 4         | F   | 267   | 0      | 0              |
| 4         | M   | 250   | 1      | 0.0039999983   |
| 5         | F   | 354   | 3      | 0.0084745735   |
| 5         | M   | 303   | 3      | 0.009900987    |
| 6         | F   | 239   | 1      | 0.0041840984   |
| 6         | M   | 248   | 7      | 0.028225794    |
| 7         | F   | 109   | 4      | 0.036697213    |
| 7         | M   | 123   | 6      | 0.04878045     |
| 8         | F   | 64    | 2      | 0.031249952    |
| 8         | M   | 37    | 5      | 0.13513477     |
| 9         | F   | 15    | 0      | 0              |
| 9         | M   | 4     | 1      | 0.24999376     |
| 10        | F   | 1     | 0      | 0              |
+-----------+-----+-------+--------+----------------+
doltsql> select * from mortality_rate_by_age_sex as of DATE_SUB(NOW(), INTERVAL 8 DAY) where age_range > 2;
+-----------+-----+-------+--------+----------------+
| age_range | sex | cases | deaths | mortality_rate |
+-----------+-----+-------+--------+----------------+
| 3         | F   | 87    | 0      | 0              |
| 3         | M   | 109   | 2      | 0.018348606    |
| 4         | F   | 110   | 0      | 0              |
| 4         | M   | 76    | 1      | 0.013157877    |
| 5         | F   | 138   | 3      | 0.021739114    |
| 5         | M   | 105   | 3      | 0.0285714      |
| 6         | F   | 98    | 2      | 0.020408142    |
| 6         | M   | 91    | 7      | 0.07692299     |
| 7         | F   | 34    | 3      | 0.088235036    |
| 7         | M   | 37    | 6      | 0.16216172     |
| 8         | F   | 11    | 3      | 0.2727248      |
| 8         | M   | 18    | 8      | 0.44444197     |
| 9         | F   | 3     | 1      | 0.33332223     |
| 9         | M   | 1     | 1      | 0.9999         |
| 10        | F   | 1     | 0      | 0              |
+-----------+-----+-------+--------+----------------+
Depending on when you’re reading this, mortality estimates will have probably changed yet again. They won’t fully stabilize until new cases stop coming in.
It’s difficult to find mortality estimates accurately broken down by both age and sex, which is an essential part of our analysis. With so much uncertainty in these figures, we’ll also run the simulation three times for the mortality dimension: twice using two mortality snapshots we’ve observed from case details published by world governments at different points in the pandemic, and once using the same information published in aggregate form by Italy based on 35,000 Italian patients as of March 19. Italy’s numbers are similar to the ones we computed based on individual case details:
+-----------+-----+-------+--------+----------------+
| age_range | sex | cases | deaths | mortality_rate |
+-----------+-----+-------+--------+----------------+
| 3         | F   | 1202  | 2      | 0.002          |
| 3         | M   | 1261  | 7      | 0.006          |
| 4         | F   | 2123  | 9      | 0.004          |
| 4         | M   | 2186  | 16     | 0.007          |
| 5         | F   | 2926  | 19     | 0.006          |
| 5         | M   | 3775  | 63     | 0.017          |
| 6         | F   | 2025  | 57     | 0.028          |
| 6         | M   | 4221  | 252    | 0.06           |
| 7         | F   | 2290  | 246    | 0.107          |
| 7         | M   | 4702  | 837    | 0.178          |
| 8         | F   | 2100  | 402    | 0.191          |
| 8         | M   | 3158  | 835    | 0.264          |
| 9         | F   | 694   | 155    | 0.223          |
| 9         | M   | 397   | 129    | 0.325          |
+-----------+-----+-------+--------+----------------+
Simulation runs#
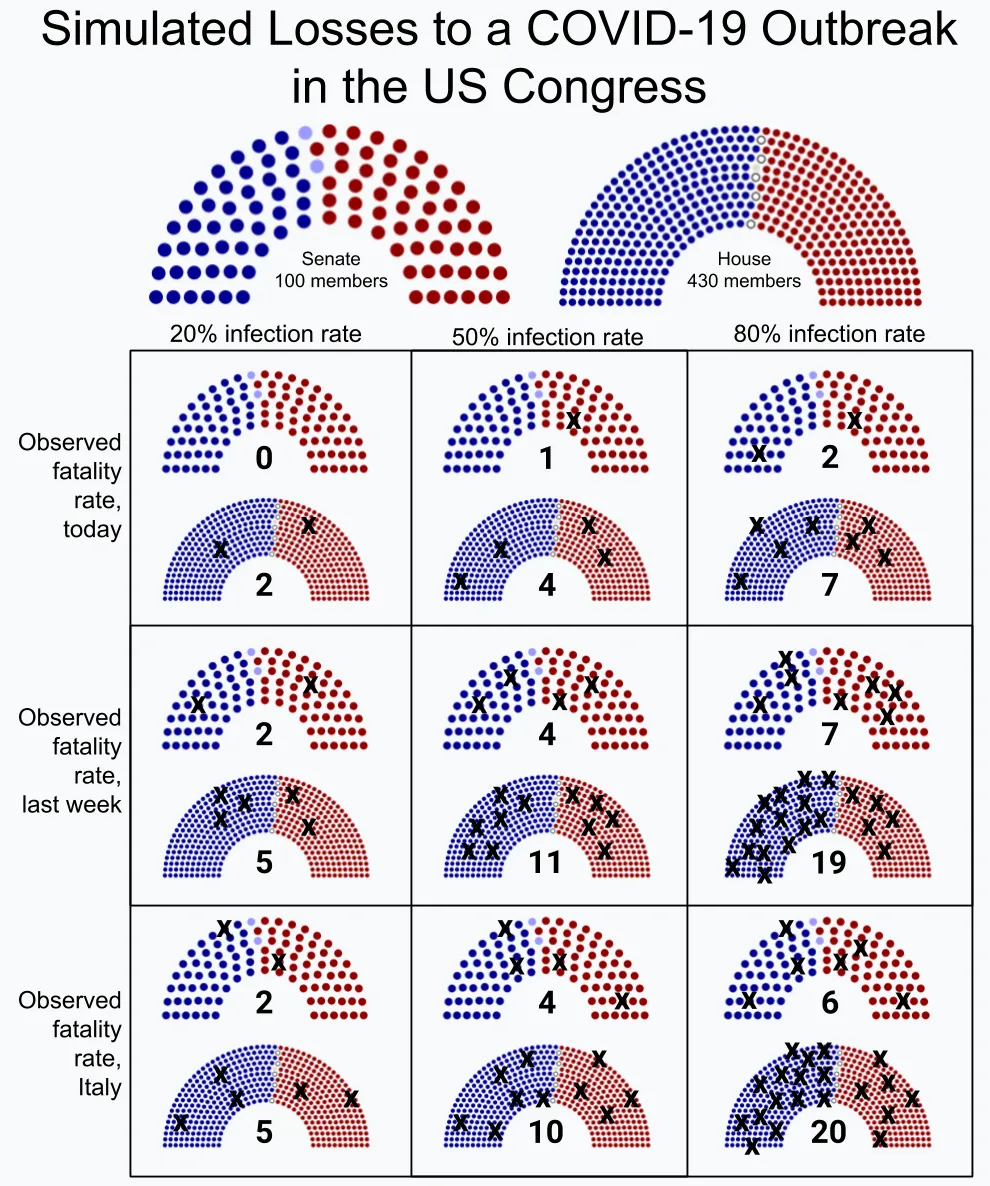
We have three different experimental values for each of two independent inputs, for a total of nine simulated scenarios. For each one, we’ll estimate how many members of each major party in each house of Congress we can expect to lose under the conditions simulated.
Getting input for the simulation#
To get input for our simulation, we need to generate datasets for it
to operate on. Joins across repositories are still a work in progress,
so for now I just exported data from the corona-virus dataset to
import into the us-congress dataset. The easiest way to do this is
by exporting the results into a CSV file using the -r csv option to
dolt sql:
% dolt sql -r csv -q \
    "select * from mortality_rate_by_age_sex as of DATE_SUB(NOW(), INTERVAL 7 DAY)" \
    > mortality_rates_by_age_sex_1_week.csv
% dolt sql -r csv -q \
    "select * from mortality_rate_by_age_sex" \
    > mortality_rates_by_age_sex.csv
Next, I created new branches of the us-congress dataset, one for each
of the different mortality rate estimates we’ll use in the
simulation. Each different branch has different contents for the
mortality_rate_by_age_sex table, corresponding to the three
different mortality rate estimate tables above.
% cd ../us-congress
% dolt checkout -b mortality_case_details
% dolt table import -u mortality_rate_by_age_sex ../mortality_rates_by_age_sex.csv
% dolt add . && dolt commit -m "Mortality rates"
% dolt checkout master && dolt checkout -b mortality_case_details_1_week
% dolt table import -u mortality_rate_by_age_sex ../mortality_rates_by_age_sex_1_week.csv
% dolt add . && dolt commit -m "Mortality rates one week ago"
% dolt checkout master && dolt checkout -b mortality_italy
% dolt table import -u mortality_rate_by_age_sex ../mortality_italy.csv
% dolt add . && dolt commit -m "Mortality rates in Italy"
% dolt checkout master
% dolt branch
* master
  mortality_case_details
  mortality_case_details_1_week
  mortality_italy
Next, I need to run a couple queries for each branch of the data set,
joining the mortality rate estimates to representatives’ age and
sex. Note the use of AS OF to select the appropriate branch of the
table to join. This lets me keep the master branch checked out, but
query the tables in the other branches I just created:
doltsql> select last_name, state, party, s.sex, 2020-YEAR(birth_date) as age, m.mortality_rate
         from senate s
         join mortality_rate_by_age_sex as of 'mortality_case_details' m
         on (2020-YEAR(s.birth_date)) / 10 = m.age_range and s.sex = m.sex
         order by mortality_rate desc, age desc
         limit 10;
+-----------+-----------+-------------+-----+-----+----------------+
| last_name | state     | party       | sex | age | mortality_rate |
+-----------+-----------+-------------+-----+-----+----------------+
| Grassley  | Iowa      | Republican  | M   | 87  | 0.13513477     |
| Inhofe    | Oklahoma  | Republican  | M   | 86  | 0.13513477     |
| Shelby    | Alabama   | Republican  | M   | 86  | 0.13513477     |
| Roberts   | Kansas    | Republican  | M   | 84  | 0.13513477     |
| Alexander | Tennessee | Republican  | M   | 80  | 0.13513477     |
| Leahy     | Vermont   | Democratic  | M   | 80  | 0.13513477     |
| Sanders   | Vermont   | Independent | M   | 79  | 0.04878045     |
| McConnell | Kentucky  | Republican  | M   | 78  | 0.04878045     |
| Cardin    | Maryland  | Democratic  | M   | 77  | 0.04878045     |
| Risch     | Idaho     | Republican  | M   | 77  | 0.04878045     |
+-----------+-----------+-------------+-----+-----+----------------+
doltsql> select first_name, last_name, state, district, h.sex, 2020-h.birth_year as age, party, mortality_rate
         from house h
         join mortality_rate_by_age_sex as of 'mortality_case_details' m
         on h.sex = m.sex and floor((2020-h.birth_year)/10) = m.age_range
         order by mortality_rate desc
         limit 10;
+------------+------------+-------+----------+-----+-----+------------+----------------+
| first_name | last_name  | state | district | sex | age | party      | mortality_rate |
+------------+------------+-------+----------+-----+-----+------------+----------------+
| Don        | Young      | AK    | AL       | M   | 87  | Republican | 0.13513477     |
| Alcee      | Hastings   | FL    | 20       | M   | 84  | Democratic | 0.13513477     |
| John       | Lewis      | GA    | 5        | M   | 80  | Democratic | 0.13513477     |
| Hal        | Rogers     | KY    | 5        | M   | 83  | Republican | 0.13513477     |
| Steny      | Hoyer      | MD    | 5        | M   | 81  | Democratic | 0.13513477     |
| David      | Price      | NC    | 4        | M   | 80  | Democratic | 0.13513477     |
| Bill       | Pascrell   | NJ    | 9        | M   | 83  | Democratic | 0.13513477     |
| Jim        | Clyburn    | SC    | 6        | M   | 80  | Democratic | 0.13513477     |
| Tom        | O'Halleran | AZ    | 1        | M   | 74  | Democratic | 0.04878045     |
| Raul       | Grijalva   | AZ    | 3        | M   | 72  | Democratic | 0.04878045     |
+------------+------------+-------+----------+-----+-----+------------+----------------+
To get the final inputs for the simulation, I need the full join of
representatives to mortality rates for each of the two chambers of
congress and each of three mortality estimates, for a total of six
input files. My simulation script wants data in CSV form, so again I
use the -r csv option for dolt sql.
% dolt sql -r csv -q "select first_name, last_name, state, district, h.sex, 2020-h.birth_year as age, party, mortality_rate from house h join mortality_rate_by_age_sex as of 'mortality_case_details' m on h.sex = m.sex and floor((2020-h.birth_year)/10) = m.age_range order by mortality_rate desc;" > house-case-details.csv
% dolt sql -r csv -q "select last_name, state, party, s.sex, 2020-YEAR(birth_date) as age, m.mortality_rate from senate s join mortality_rate_by_age_sex as of 'mortality_case_details' m on (2020-YEAR(s.birth_date)) / 10 = m.age_range and s.sex = m.sex order by mortality_rate desc, age desc;" > senate-case-details.csv
% dolt sql -r csv -q "select first_name, last_name, state, district, h.sex, 2020-h.birth_year as age, party, mortality_rate from house h  join mortality_rate_by_age_sex as of 'mortality_case_details_1_week' m on h.sex = m.sex and floor((2020-h.birth_year)/10) = m.age_range order by mortality_rate desc;" > house-case-details-1-week.csv
% dolt sql -r csv -q "select last_name, state, party, s.sex, 2020-YEAR(birth_date) as age, m.mortality_rate from senate s join mortality_ rate_by_age_sex as of 'mortality_case_details_1_week' m on (2020-YEAR(s.birth_date)) / 10 = m.age_range and s.sex = m.sex order by mortality_rate desc, age desc;" > senate-case-details-1-week.csv
% dolt sql -r csv -q "select first_name, last_name, state, district, h.sex, 2020-h.birth_year as age, party, mortality_rate from house h join mortality_rate_by_age_sex as of 'mortality_italy' m on h.sex = m.sex and floor((2020-h.birth_year)/10) = m.age_range order by mortality_rate desc;" > house-italy.csv
% dolt sql -r csv -q "select last_name, state, party, s.sex, 2020-YEAR(birth_date) as age, m.mortality_rate from senate s join mortality_rate_by_age_sex as of 'mortality_italy' m on (2020-YEAR(s.birth_date)) / 10 = m.age_range and s.sex = m.sex order by mortality_rate desc, age desc;" > senate-italy.csv
Having produced the inputs to the simulation script, I just need to run it on each of these files for each of the three simulated spreads: 0.2, 0.5, and 0.8.
for f in `ls *.csv`
do
    for s in 0.2 0.5 0.8
    do
        ./simulation.pl -s $s < $f > "$f.$s.out"
    done;
done;
Simulation script#
Our simulation iterates over congressional representatives and their expected mortality rate based on their age and sex. Over 10,000 runs, it decides whether a particular representative is lost to us based on the spread of the disease and their expected chance of recovery. Then it takes the median outcome of the 10,000 simulated runs for each of the two major parties and produces it as output. It’s a relatively short Perl script:
#!/usr/bin/perl

use warnings;
use strict;

use Parse::CSV;
use Getopt::Long;

my $spread = 0.5;
GetOptions ("spread|s=f" => \$spread) or die ("Error in command line args");

open(my $fh, "<-:encoding(UTF-8)") or die $!;

my $num_sims = 10000;

my $csv = Parse::CSV->new(
    handle => $fh,
    names  => 1,
    );

my @reps;
while ( my $line = $csv->fetch ) {
    $line->{losses} = 0;
    push @reps, $line;
}

my %losses = (
    'Republican' => [],
    'Democratic' => [],
    'Independent' => [],
    );

foreach my $i ( 1..$num_sims ) {
    my @losses;
    foreach my $rep ( @reps ) {
        # Roll the dice twice: once to see if they contract COVID-19, and again to determine their outcome
        if ( rand() < $spread && rand() < $rep->{mortality_rate} ) {
            $rep->{losses} += 1;
            push @losses, $rep;
        }
    }

    while ( my ($party, $loss_count) = each %losses ) {
        my @party_losses = grep { $_->{party} eq $party } @losses;
        push @$loss_count, scalar(@party_losses);
    }
}

while ( my ($party, $loss_count) = each %losses ) {
    my @sorted_losses = sort @$loss_count;
    my $median_losses = $sorted_losses[$num_sims / 2];
    print "$party party lost a median $median_losses representatives\n";
}
Finally, I used this output to produce the diagram below, placing an X on the appropriate side of the aisle for each simulation scenario.
Simulation results#
Discussion#
These simulations demonstrate that even with conservative estimates of spread and fatality, we can expect to lose some members of Congress to COVID-19. In the worst case, we can expect to lose a tragic number. And in all scenarios, the number of representatives seriously ill and therefore unable to perform their duties will always be higher than the number we lose altogether.
This isn’t a node-based simulation, so it doesn’t account for which representatives are spending time in close contact with one another. Nor does it account for the known diagnoses of COVID-19 among legislators (three to date). It’s just a straightforward application of statistical mortality rates applied evenly to the entire Congress, based on their age and sex.
The age and sex distribution of the two parties means that on average the Republicans are more at risk in the Senate, and the Democrats more at risk in the House. But this virus doesn’t care about political ideology, and our government’s response must rise above such divisions if we are to successfully fight it.
It’s important to note that we have reason to believe that things won’t be as bad as even the mildest simulation result. Italy’s mortality numbers are as bad as they are at least in part because their health care system is completely overwhelmed, and doctors are having to decide who gets ventilated and who has to do without. From reports on the ground, doctors are often choosing to ventilate patients with a better chance of survival, inflating the already terrible fatality numbers for the elderly. Whatever happens during the pandemic, we tend to believe that every member of Congress or other high-ranking government official will receive the very highest standard of care, and this should substantially improve their outcomes relative to the general population.
Still, even with that caveat, these results are chilling.
Conclusion#
We hope that these results demonstrate concisely just how seriously our elected officials should be taking the threat of the COVID-19 pandemic. Not only is it endangering the lives of countless ordinary Americans, but the demographic characteristics of our legislative representatives put them at a disproportionate risk relative to the general population.
Here at DoltHub, we have been aggregating COVID-19 data sets in the hope that someone can make use of them to assist in the effort to control and ultimately end the pandemic. If you know of a COVID-19 data set that we should have, please let us know! Or better yet, download Dolt today to clone our data, improve it, and send your updates to us as a pull request.
We built Dolt to make it as easy to collaborate on data as it is to collaborate on source code. When we launched our first beta a year ago, we never imagined we would be spending so much of our time compiling data on a global pandemic. But here we are. We believe that Dolt is the best way to produce and distribute data sets, and our biggest hope is that our efforts contribute in some small way to mitigating the terrible effects of this pandemic. If you would like to help, please download Dolt and join us in building the most comprehensively useful COVID-19 dataset on the internet.