
On Saturday, February 29, this transpired in our company chat room:

A project was born.
We had time series data for confirmed cases, deaths, and recoveries segmented by location sourced from John Hopkins but we did not have individual case data. We set out to amass individual case data. Nine days later on March 9, we believe we assembled the most comprehensive open individual case dataset for Novel Coronavirus.

This blog explains how we got here.
China CDC Paper#
First, I had to find the source of the data Brian was referring to in his chat. A little Google searching led me to this February 11, 2020 paper from the China Center for Disease Control (CDC). This paper uses 72,314 private individual case records. The results in Table 1 of the paper use 44,672 confirmed cases to estimate the virus’s effect on different age groups, genders, occupations, etc.
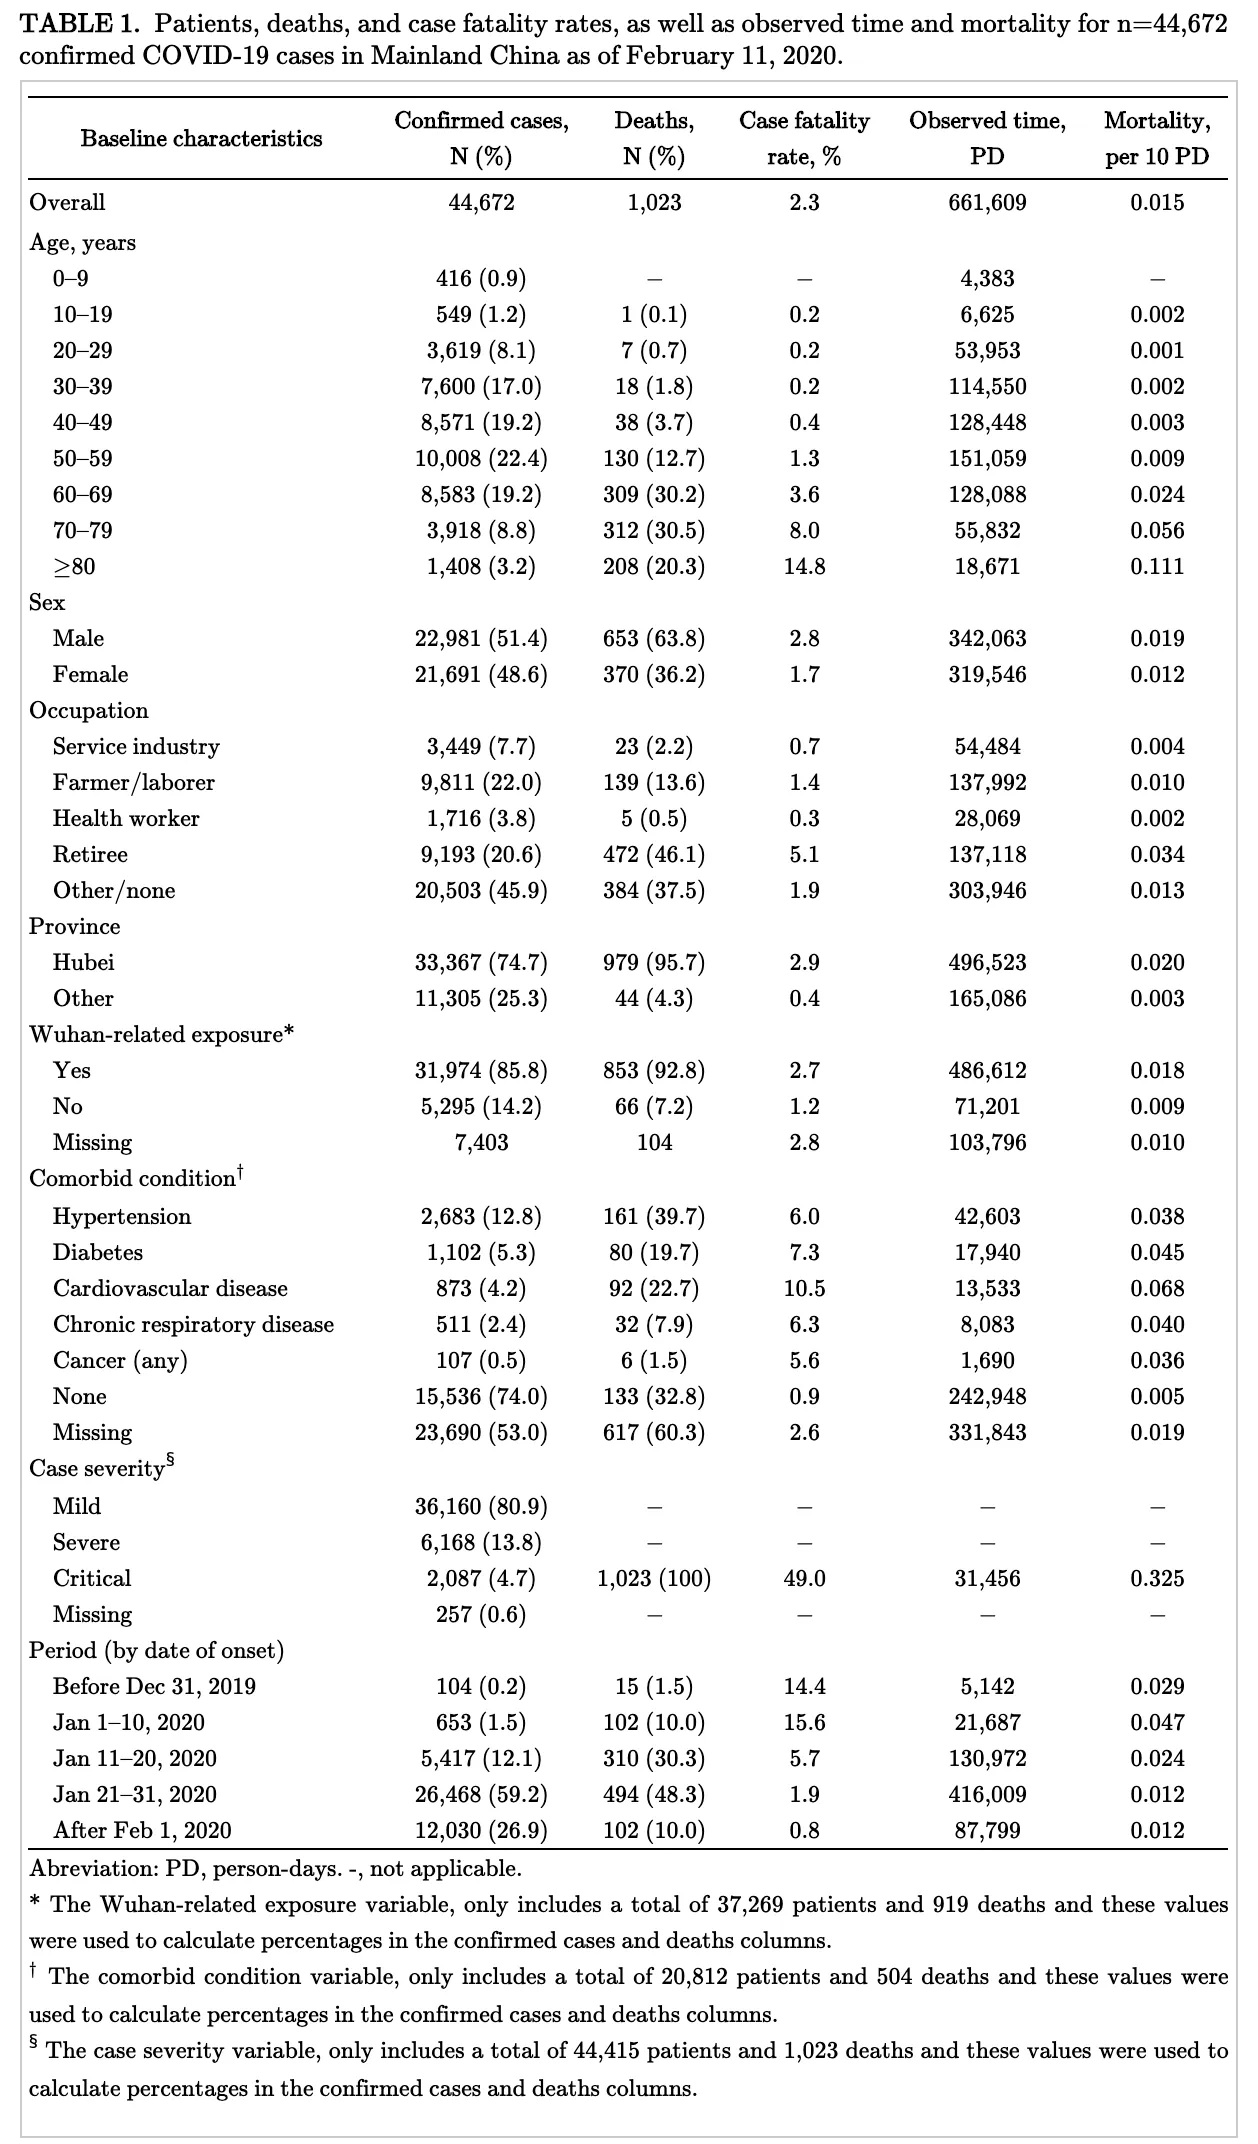
This is incredible data. It has shaped how we talk about the virus. When people talk about mortality rates among the elderly, they are referring to the data presented in this paper.
We imported the eight sub-tables in this table into Dolt. The Dolt tables are named characteristics_. This is the table for age. This is cool and all but we didn’t feel like we added much value. The tables weren’t updating. There wasn’t much more to do with the data. How could we get raw case details data? On March 2, we updated the README asking for help and waited.
timsehn$ dolt diff djgn7ch0lr0hgh416alb2lr66tt2k06l lgt6pgb6qo7a85af1vtlgpqgiad68ouh | grep tim@liquidata.co
+ Additionally, there is `characteristics_*` tables sourced from the [China Center for Disease Control Feb. 11, 2020 report](http://weekly.chinacdc.cn/en/article/id/e53946e2-c6c4-41e9-9a9b-fea8db1a8f51). This data has a summary breakdown of cases and mortality by characteristics like age, sex, comorbid condition, etc. This data will not update automatically. It is a one time set of summary data. If anyone has raw data on patient characteristics, please email: tim@liquidata.co.
Enter Singapore#
Twitter swoops in with help on March 3.
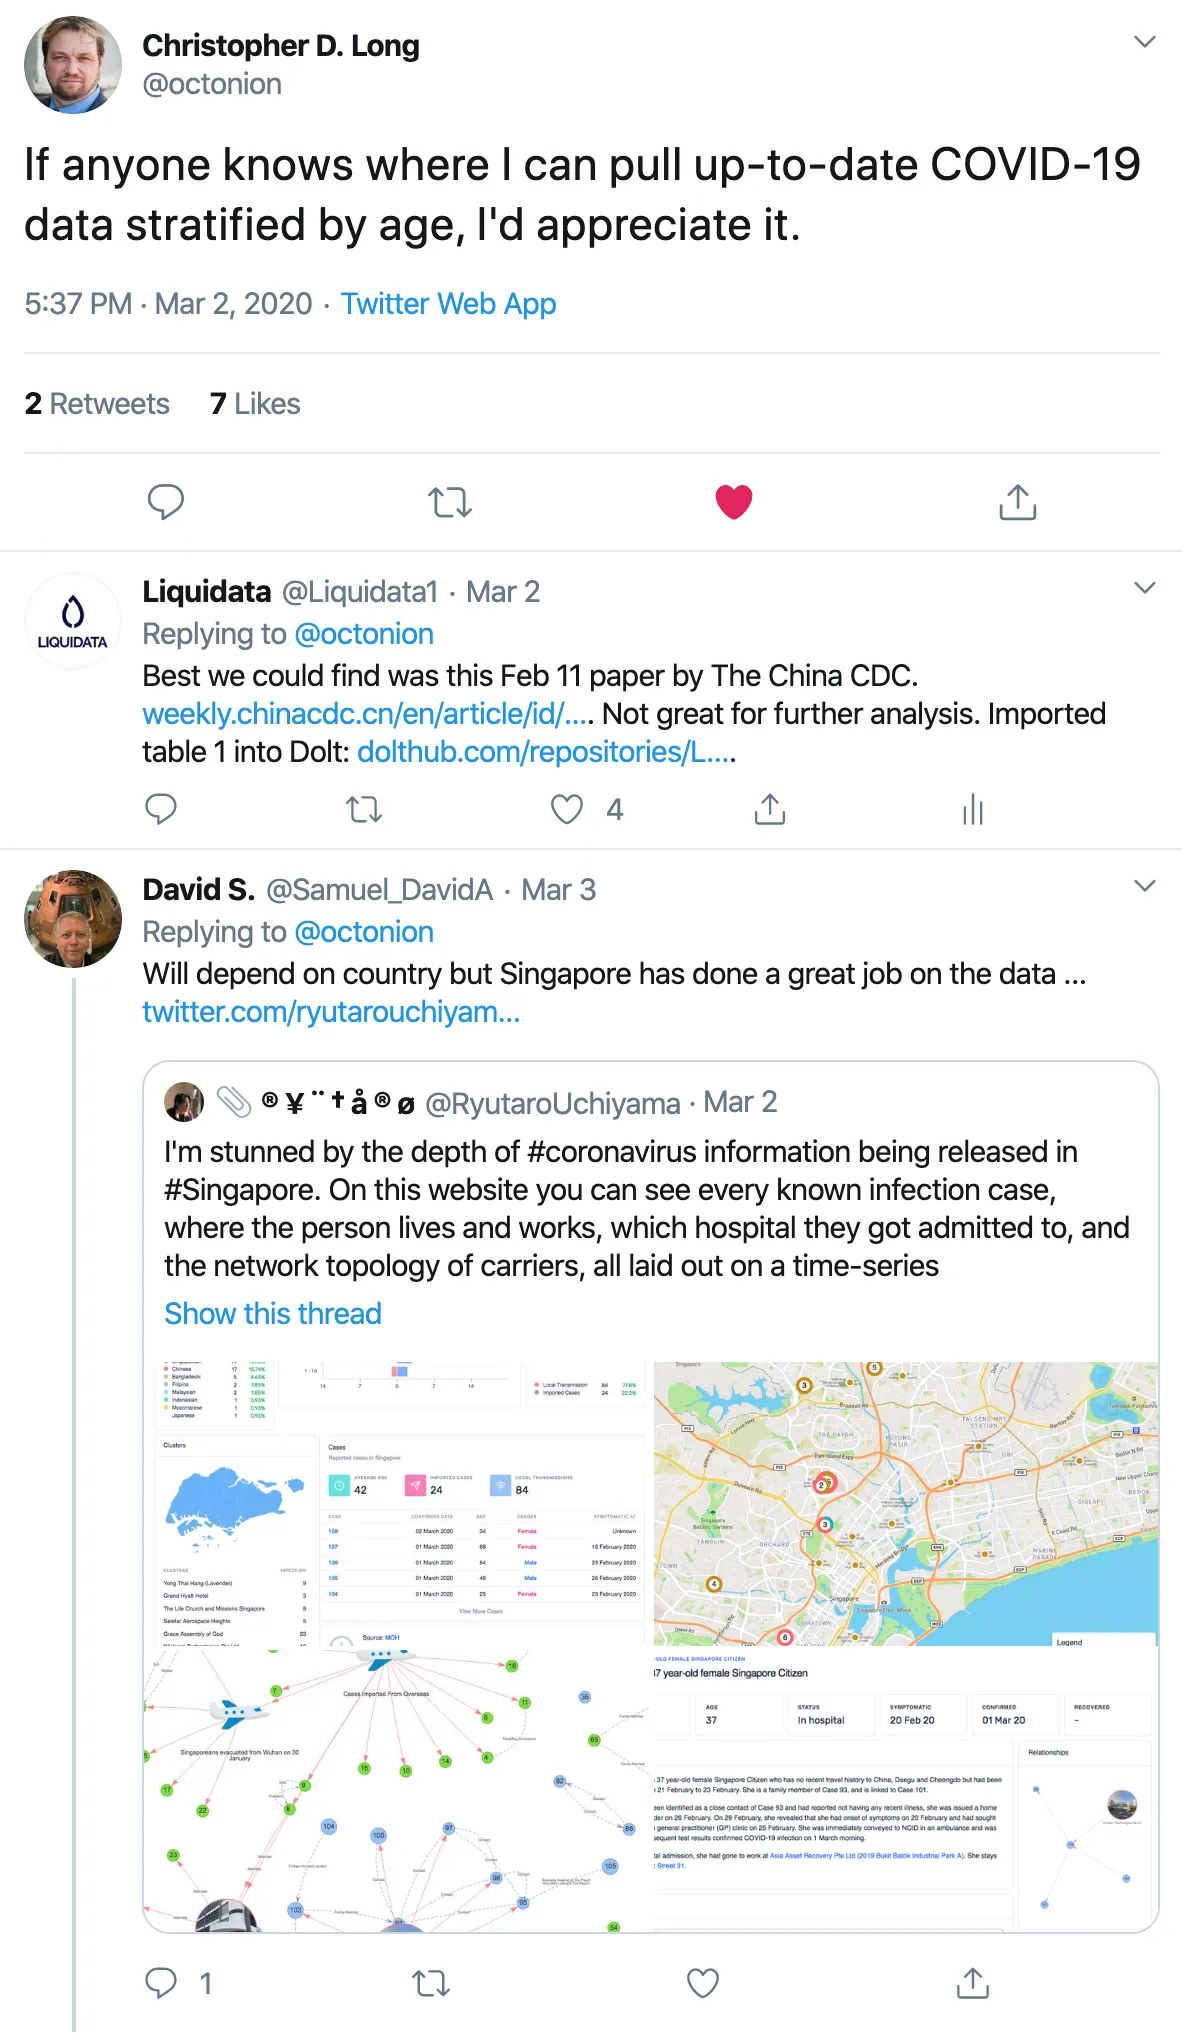
The Singapore government is publishing extremely detailed Novel Coronavirus case details for all 160 or so infected patients in Singapore. A local college made a website to display the data.
We used the Singapore website to create a case_details table in the dolthub/corona-virus Dolt repository.
timsehn$ dolt schema show case_details
case_details @ working
CREATE TABLE `case_details` (
  `source` TEXT NOT NULL COMMENT 'tag:0',
  `case_id` INT NOT NULL COMMENT 'tag:1',
  `case_name` TEXT COMMENT 'tag:2',
  `age` INT COMMENT 'tag:3',
  `sex` CHAR(1) COMMENT 'tag:4',
  `nationality` TEXT COMMENT 'tag:5',
  `current_status` TEXT COMMENT 'tag:6',
  `symptomatic_date` DATETIME COMMENT 'tag:7',
  `confirmed_date` DATETIME COMMENT 'tag:8',
  `recovered_date` DATETIME COMMENT 'tag:9',
  `place_id` INT COMMENT 'tag:10',
  PRIMARY KEY (`source`,`case_id`)
);
We wrote this script to fill in the data. We began running the script every hour. We now had individual case details for about 150 patients.
Dolt is really useful here because we can run our original import job on the cases and places tables and this job on the case_details table. Dolt is a relational database. Updating tables independently is one of the strengths of relational databases. We don’t have to worry about conflicting writes between those jobs because a merge will not generate a conflict. Moreover, we can inspect a diff between runs to make sure the import job is doing the right thing, a feature unique to Dolt.
Next, Hong Kong#
Twitter again let us know Hong Kong also was publishing Novel Coronavirus case details on a website. Hong Kong started publishing the data on January 28 but we only found it via tweet on March 5.
This website happened to be a React application so simple scraping would not do. We had to learn how to scrape a lazy-loaded website. We have an upcoming blog about our journey. We had to convert the data on the Hong Kong website into the Singapore schema. This is the resulting import script. It runs on the hour, just like the Singapore version.
Again, Dolt was really useful here because the two jobs could operate on the same table at the same time without generating merge conflicts because each job was touching different rows. Imagine if I was using a CSV. If the size of the data changed merging two copies would almost certainly generate a conflict. So, I would need some sort of locking mechanism such that only one writer operated on the CSV at a time. Dolt avoids this locking headache entirely.
We now had about 250 individual case details updating automatically on the hour. This would be useful for supplemental analysis but it was not yet a big enough sample to produce meaningful results.
Finally, South Korea#
Twitter again notified us on March 9 via the Kaggle feed that South Korea released individual Novel Coronavirus case details on GitHub. South Korea has about 7500 individual patients with Coronavirus. We immediately set out building an import script, again coercing the data into the Singapore schema. Within an hour the data was imported and the update job was deployed.
Now we had over 7500 individual cases across three countries updating automatically. We believe this is the biggest public individual Novel Coronavirus case details assembled. Check it out for yourself.
Using Case Details Data#
The motivation for gathering this data was to reproduce the China CDC Table 1. This data can support creating mortality rates by age range and sex. We built views and sample queries to generate those tables in Dolt.
timsehn$ dolt sql -q "select * from mortality_rate_by_sex where sex is not null"
+-----+-------+--------+----------------------+
| sex | cases | deaths | mortality_rate       |
+-----+-------+--------+----------------------+
| F   | 563   | 12     | 0.021314383425509162 |
| M   | 477   | 27     | 0.05660376171828895  |
+-----+-------+--------+----------------------+
You can view reproductions of the mortality rate by age range and mortality rate by sex tables using Singapore, Hong Kong, and South Korea on DoltHub.
The mortality rates by patient days are also within reach. Most of the cases have confirmed date and some even have symptomatic date. Feel free to clone the repository and explore for yourself.
Moreover, we also produced mortality rates by sex and age range showing that at every age range men do markedly worse than women combating the virus. This is a new view that was not included in the China CDC report.
Next Steps#
We’re still looking for more sources of individual case details. If you find some, please email me at tim@dolthub.com.
We considered sourcing case details from news articles and using DoltHub’s pull request system to manage our work. An early iteration of what that might look like can be seen here. If you are interested in that work, also please let me know.
We hope Dolt and DoltHub are useful in spreading information about the Novel Coronavirus (COVID-19). We will continue to support the data effort as best we can.