
John Hopkins University Center for Systems Science and Engineering began collecting, tabulating, and publishing Novel Coronavirus (COVID-19) data on January 31, 2020. We started importing this dataset into Dolt on February 5, 2020. This blog will explore the Novel Coronavirus dataset and explain how Dolt adds value to it.
What’s in the dataset?#
The dataset is a series of placed and timed observations of confirmed cases, deaths, and recoveries from Novel Coronavirus. A single table with the following schema was considered:
CREATE TABLE `observations` (
  `country_region` LONGTEXT,
  `province_state` LONGTEXT,
  `latitude` DOUBLE,
  `longitude` DOUBLE,
  `observation_time` DATETIME,
  `cases_count` BIGINT,
  `death_count` BIGINT,
  `recovered_count` BIGINT,
  PRIMARY KEY (`country_region`, `province_state`, `observation_time`)
);
However, after observing multiple versions of the data, the country_region and province_state fields would often be updated independently of the corresponding counts. Moreover, the province_state field would often be empty. These two features of the data make it tricky to import this dataset into Dolt. Let’s examine why.
Let’s first explore independent updating of columns. For instance, the data would start off with a country_region only, say Germany, with no province_state. Later, the province_state column would be filled in as cases were attributed to particular regions in Germany, e.g. Bavaria. In Dolt, primary keys are how we track lineage of a row. So, changes like the above would appear as a delete and an insert rather than an update. That is not ideal when examining the history of the dataset, which Dolt is uniquely capable of. If a user is using Dolt to consume this data, it’s likely they want a coherent history.
Secondly, the data contained empty province_state columns. Dolt does not allow NULL primary keys even as part of a multiple primary key table. Dolt is a SQL database and most SQL databases do not tolerate NULL primary keys. So, we needed to work around this in the schema.
Considering these two issues, we decided to break the data into two tables:
CREATE TABLE `cases` (
  `observation_time` DATETIME,
  `place_id` BIGINT,
  `confirmed_count` BIGINT,
  `recovered_count` BIGINT,
  `death_count` BIGINT,
  PRIMARY KEY (`observation_time`,`place_id`)
);

CREATE TABLE `places` (
  `place_id` BIGINT,
  `province_state` LONGTEXT,
  `country_region` LONGTEXT,
  `latitude` DOUBLE,
  `longitude` DOUBLE,
  PRIMARY KEY (`place_id`)
);
This two-table schema allows us to update the information about a place independently of the observations from a place and solves the NULL primary key issue.
How is the data mirrored to Dolt?#
Eventually, we believe Dolt and DoltHub are ideal tools to master datasets like the Novel Coronavirus dataset. The Novel Coronavirus dataset was first mastered in a Google Sheet and then migrated to a GitHub repository. We are getting pretty familiar with the tools needed to mirror datasets from other places on the internet into Dolt and DoltHub.
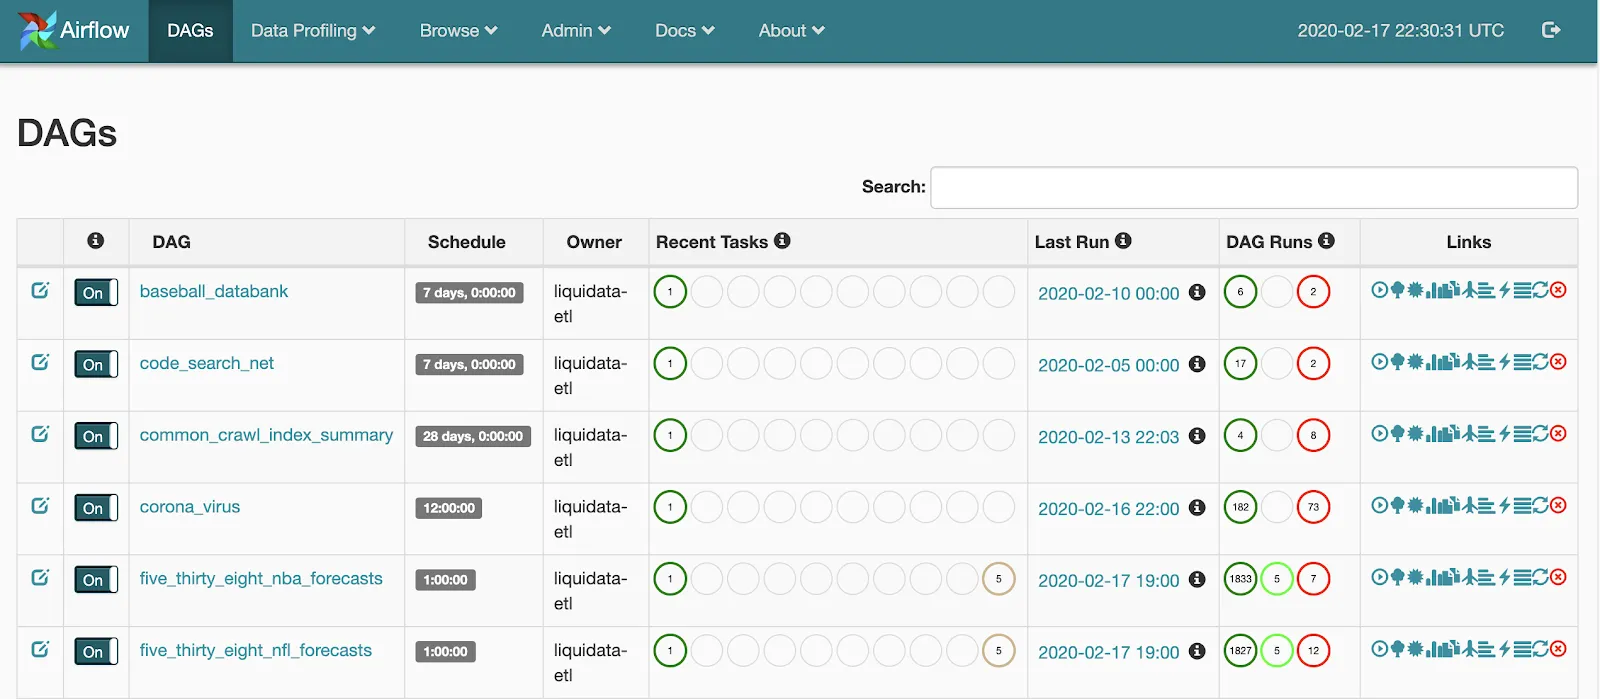
We set up a job execution environment using Airflow. This allows us to execute arbitrary Dolt import jobs and gives us a convenient interface to see if our jobs are working or not.
For this import job, we currently are running this Perl script. We use the time_series comma separated values files (or Google sheets in earlier versions) and work through each row horizontally, creating an entry in the cases table every time a new count occurs.
You can see how the Perl script changed over time as the source of the data changed. An astute code reviewer would notice that there are a lot of manual updates to the place_id map. Whenever a new place is added or a place country_region or province_state is changed, the script must be updated. This is not ideal but it’s work we’re happy to do to produce a cleanly versioned dataset.
The dolthub-etl-jobs GitHub repository is open source. If you would like to write a Dolt import job that produces a public dataset for DoltHub, we’re happy to take that contribution and run it on your behalf. In the long run, we will likely create a more user-friendly import process with a bunch of features like versioning the import code along with the data. Stay tuned here. It’s an area we’re very excited to innovate in.
What can you do with the dataset?#
There are two primary ways to use the Novel Coronavirus dataset:
- To produce a time series table explaining the progression of the virus in various locations
- To see how the virus looked at a given point in time, including the present.
To make accomplishing these goals easier for users of this dataset, we used our newly released Dolt feature, SQL Views.
To see a time series representation of the data, run select * from time_series in the Dolt repository. We have defined a time_series SQL View defined in Dolt.
Naively, you can produce a time series for the confirmed cases using the following query:
SELECT `place_id`, `observation_time`, `confirmed_count`
FROM `cases`
ORDER BY `place_id` ASC, `observation_time` ASC
Unfortunately, this produces a time_series with NULL values for the counts that have not changed since the previous observation. This is apparently a pretty famous problem in SQL and one of the motivations for SQL window functions like PARTITION and APPLY. We don’t have these functions in Dolt yet so we had to go with a subselect. To replace the NULL values with the latest stated measurement, the following query is needed:
SELECT a.place_id, a.observation_time,
    CASE WHEN
        a.confirmed_count IS NOT NULL THEN a.confirmed_count
    ELSE
        (SELECT b.confirmed_count FROM cases b
             WHERE b.observation_time < a.observation_time
             AND b.confirmed_count IS NOT NULL
             AND a.place_id = b.place_id
             ORDER BY b.observation_time DESC LIMIT 1)
    END AS confirmed
FROM cases AS a
ORDER BY a.place_id, a.observation_time;
Unfortunately, as we were composing this blog entry we realized that in Dolt subselects could not access variables in the outer scope. That’s a bug. So, at the time of this composition, the time_series view on the corona-virus Dolt repository does not fill NULL values. Keep track of this issue on GitHub for updates. Once we fix the issue, we’ll change the View in the corona-virus Dolt repository.
To see a current view of the data, run select * from current in the Dolt repository. The construction of this view is described in detail in Aaron’s blog post.
To get a snapshot of the data at a given point in time does not lend itself well to Views. You cannot pass variables to Views. This query does the trick to select confirmed cases for January 31, 2020:
SELECT country_region AS country, province_state AS state, max(observation_time) AS last_updated, confirmed_count
FROM cases NATURAL JOIN places
WHERE observation_time <= '2020-01-31 00:00:00' AND confirmed_count IS NOT NULL
GROUP BY place_id ORDER BY confirmed_count DESC
Conveniently, I have saved all three of these queries to the Dolt query catalog for the corona-virus repository, a new feature we’ve launched in Dolt and DoltHub. The query catalog allows saved queries to travel along with the Dolt repository as living documentation. This is an innovative feature designed for data sharing and we’ll publish a blog post dedicated to it soon.
What does Dolt add?#
The biggest thing Dolt adds is data-friendly diffs. Compare the equivalent diff on GitHub with the diff on DoltHub. On DoltHub, it’s clear to a human reader that data was added for February 22, 2020 and a couple place names were changed to reference the cases originated from the Diamond Princess Cruise Ship. Dolt diffs are a powerful way to understand the data and how it’s changing over time.
Moreover, Dolt allows you to examine the lineage and diffs of the data using SQL, the same query language you use to create, read, update, and delete the data. You can query the history of any cell (i.e. row, column pair) in the database. For instance, in the above diff, you’ll notice the province_state for place_id 78 has been modified. What’s the history of that row, column pair? You can get that with a query.
timsehn$ dolt sql -q "select * from dolt_history_places where place_id=78"
+-----------------------------------+----------------+----------+-----------+----------+----------------------------------+------------------------+-----------------------------------+
| province_state                    | country_region | latitude | longitude | place_id | commit_hash                      | committer              | commit_date                       |
+-----------------------------------+----------------+----------+-----------+----------+----------------------------------+------------------------+-----------------------------------+
| Omaha, NE (From Diamond Princess) | US             | 41.2545  | -95.9758  | 78       | l3h6tama110pmbluiv3jacrnumjettns | LiquidataSystemAccount | 2020-02-23 17:08:17.765 +0000 UTC |
| Ashland, NE                       | US             | 41.0652  | -96.3339  | 78       | phg9a8og7ge1nq6ogb6691podhrva26l | LiquidataSystemAccount | 2020-02-22 16:41:03.938 +0000 UTC |
| Omaha, NE                         | US             | 41.2545  | -95.9758  | 78       | ch4g82ip0bdnuefdlfo6m7nk7jt4decs | LiquidataSystemAccount | 2020-02-19 15:51:28.703 +0000 UTC |
+-----------------------------------+----------------+----------+-----------+----------+----------------------------------+------------------------+-----------------------------------+
It looks like it took a few commits for the creator of this data to decide where exactly in Nebraska to attribute these cases.
Examining the commit log for this dataset, it looks like commits are labeled either by an automated importer or a human modifier. Let’s grab all the commits made by the automated importer using a query.
timsehn$ dolt sql -q "select * from dolt_log where message like 'Automated import%' order by date desc limit 3"
+----------------------------------+------------------------+------------------------+-----------------------------------+---------------------------------------------------------------------------------------------------------------------------------------------------------------------------------------------+
| commit_hash                      | committer              | email                  | date                              | message                                                                                                                                                                                     |
+----------------------------------+------------------------+------------------------+-----------------------------------+---------------------------------------------------------------------------------------------------------------------------------------------------------------------------------------------+
| l3h6tama110pmbluiv3jacrnumjettns | LiquidataSystemAccount | liquidatasys@gmail.com | 2020-02-23 17:08:17.765 +0000 UTC | Automated import of new data downloaded from https://raw.githubusercontent.com/CSSEGISandData/COVID-19/master/csse_covid_19_data/csse_covid_19_time_series/ at Sun Feb 23 17:08:17 2020 GMT |
| phg9a8og7ge1nq6ogb6691podhrva26l | LiquidataSystemAccount | liquidatasys@gmail.com | 2020-02-22 16:41:03.938 +0000 UTC | Automated import of new data downloaded from https://raw.githubusercontent.com/CSSEGISandData/COVID-19/master/csse_covid_19_data/csse_covid_19_time_series/ at Sat Feb 22 16:41:03 2020 GMT |
| o0kps99crujnum0fc2joiebii3r135gk | LiquidataSystemAccount | liquidatasys@gmail.com | 2020-02-21 10:03:04.98 +0000 UTC  | Automated import of new data downloaded from https://raw.githubusercontent.com/CSSEGISandData/COVID-19/master/csse_covid_19_data/csse_covid_19_time_series/ at Fri Feb 21 10:03:04 2020 GMT |
+----------------------------------+------------------------+------------------------+-----------------------------------+---------------------------------------------------------------------------------------------------------------------------------------------------------------------------------------------+
Being able to examine the commit history of with a query language allows you to ask questions like, did I only get yesterday’s data in today’s changes? Or, was yesterday a pure append (i.e. only new data was added)? Or, did I get some corrections (i.e. data from earlier dates was changed)?
timsehn$ dolt sql -q "select *, (select date_sub(max(to_observation_time), interval 1 day) from dolt_diff_cases where from_commit='phg9a8og7ge1nq6ogb6691podhrva26l' and to_commit='l3h6tama110pmbluiv3jacrnumjettns') as max_expected_date from dolt_diff_cases where from_commit='phg9a8og7ge1nq6ogb6691podhrva26l' and to_commit='l3h6tama110pmbluiv3jacrnumjettns' and (to_observation_time < max_expected_date or from_observation_time < max_expected_date)"
+---------------------+-------------+--------------------+--------------------+----------------+-----------+-----------------------+---------------+----------------------+----------------------+------------------+-------------+-----------+-------------------+-------------------+
| to_observation_time | to_place_id | to_confirmed_count | to_recovered_count | to_death_count | to_commit | from_observation_time | from_place_id | from_confirmed_count | from_recovered_count | from_death_count | from_commit | diff_type | max_expected_date | max_expected_date |
+---------------------+-------------+--------------------+--------------------+----------------+-----------+-----------------------+---------------+----------------------+----------------------+------------------+-------------+-----------+-------------------+-------------------+
+---------------------+-------------+--------------------+--------------------+----------------+-----------+-----------------------+---------------+----------------------+----------------------+------------------+-------------+-----------+-------------------+-------------------+
The above query returns no rows meaning that only data from the last 24 hours has been updated in the Feb 23, 2020 commit. You can use queries like this to make decisions on what to do with downstream processes that consume this data. Was data corrected from an earlier time period? If so, we were making assumptions or models based on incorrect data.
Again, Dolt allows you to save queries like the ones above to a query catalog for documentation. DoltHub allows users to see and run those queries on the web. The corona-virus dataset on DoltHub has these and other interesting sample queries to explore.
In closing…#
We hope that this corona-virus dataset on Dolt will be a small contribution to help contain this virus. Please explore and use this and other data with Dolt and DoltHub.