
We’re using Go to write Dolt, the world’s first version-controlled SQL database. Writing a database is hard to get right, so we have lots of tests, millions and millions of them. We care a lot about the database being well-tested and correct, so we gate our releases on any test regressions.
But there is one aspect of testing we haven’t paid much attention to so far: test coverage. Test coverage is a form of instrumentation that can tell you which lines of code are being exercised by you tests (covered) and which aren’t (uncovered). Many of our engineers come from a Java background, where code coverage reporting tools were a standard part of many build platforms and people put a lot of effort into getting better coverage numbers. Go has had some form of support for code coverage analysis since all the way back to version 1.2, but from what I can tell this practice simply never achieved the same prominence in the Go community that it did in the Java community. At least, I never hear Go engineers talk about test coverage the way I recall Java engineers obsessing about test coverage, although of course your experience may be different.
So DoltHub has basically been a test-coverage-free zone since the beginning. But recently one of our
engineers noticed that Go added support for coverage instrumentation in normal binaries, not just as
part of go test, a few years ago back in 1.20. This matters to
us because a good share of our test coverage comes from integration tests, which involve running the
binary directly and checking some result, as opposed to invoking go test. In particular, we have
thousands of BATS tests for our CLI, and a
large part of the code base is only exercised by these tests. Once we realized that we can
now get a combined coverage report of our unit and integration tests, I thought it would be an
interesting experiment, just to see where we stand.
We are about three years late to this experiment, but better late than never. And since I so rarely see test coverage discussed in Go communities, I wanted to see for myself how these tools worked and if they were worth integrating into our builds.
Getting test coverage for unit tests#
Getting coverage data for unit tests (or any tests you invoke with go test) is easiest, so let’s
start there. It’s as simple as adding a few arguments to go test. Here’s what it looks like:
go test -cover -coverpkg="$COV_PKGS" ./... -args -test.gocoverdir=/tmp/coverdata/unitLet’s go over it piece by piece.
-coverturns coverage data on for this test run.-coverpkgis the set of packages you want instrumented for coverage data, separated by commas. By default, this is the set of packages imported directly (not transitively) by any test files. More on that in a second.-args -test.gocoverdir=/tmp/coverdata/unitspecifies a path to a directory to put coverage report files.
Note that there are two coverage formats you can get from go test. The commands above produce the
newer format released for integration tests in 1.20, which makes them possible to merge from
multiple runs into a single report, so that’s definitely what we want. For a simple text-based
coverage report, you can pass the -coverprofile=<output> flag and omit the others.
Running this command will produce a pair of files in the gocoverdir you specified, something like this:
covcounters.c6de772f99010ef5925877a7b05db4cc.2424989.1670252383678349347
covmeta.c6de772f99010ef5925877a7b05db4cc
We’ll need those later, when we go to analyze the results.
Finding a set of packages to instrument for coverage data#
By default, Go coverage tools only instrument and report on packages that were directly (not
transitively) imported by the main package or the test files run. This is probably not what you
want. You probably want to instrument and collect coverage data on your entire code base. Luckily
there’s an easy way to do this.
go list -f '{{if not .Standard}}{{.ImportPath}}{{end}}' -deps . | \
    grep dolthub | paste -sd"," - > "pkgs.txt"
This go list command lists all the transitive dependencies of a set of source files (running here
in our main package’s directory). Then we filter those to the ones in our company name space, join
them together separated by commas with paste, and then write it to a file.
Now that we have this file, we can set it into an env variable to easily pass it to the coverage tools that require it.
export COV_PKGS=$(cat pkgs.txt)Getting coverage data for integration tests#
To instrument a binary you would like to use for integration testing with coverage data, pass the
same commands we did for go test:
go build -cover -coverpkg="$COV_PKGS" ./cmd/dolt/.Then, when you run your instrumented binary, specify a directory for coverage information with the
GOCOVERDIR environment variable.
export GOCOVERDIR=/tmp/coverdata/integrationNow any runs of our instrumented binary will produce coverage files in /tmp/coverdata/integration.
Generating a coverage report#
Now that we’ve instrumented our binary and run a bunch of integration tests, we’ll have a bunch of coverage files in various directories. All that remains is to run a report to see, line-by-line, what parts of our code base are covered or not.
To generate a coverage report is a two-step process. First run go tool covdata command, which you
invoke on the directories that have coverage reports in them.
go tool covdata textfmt -i /tmp/coverdata/unit,/tmp/coverdata/integration -o cov.outgo tool covdata has a bunch of different commands you can provide to do various things, and you
can read more about them in the documentation on this feature. But
the one we’re interested in today is textfmt, which converts the coverage data into the “legacy”
text format still used by the go tool cover command to produce various reports, so that’s what we
want.
Now that we have a text format coverage summary in cov.out, we can run reports on it with the go tool cover command. It too has various options for output, but if you’re anything like me you want
a nice web page of results you can browse. That’s the -html option.
go tool cover -html=cov.outRunning this command produces a coverage.html file and launches your browser to view it.
The coverage.html file#
coverage.html is a single HTML file that includes line-by-line coverage info for your entire code
base. It functions like a single-page app, showing you one source file of coverage data at a
time. It looks like this:
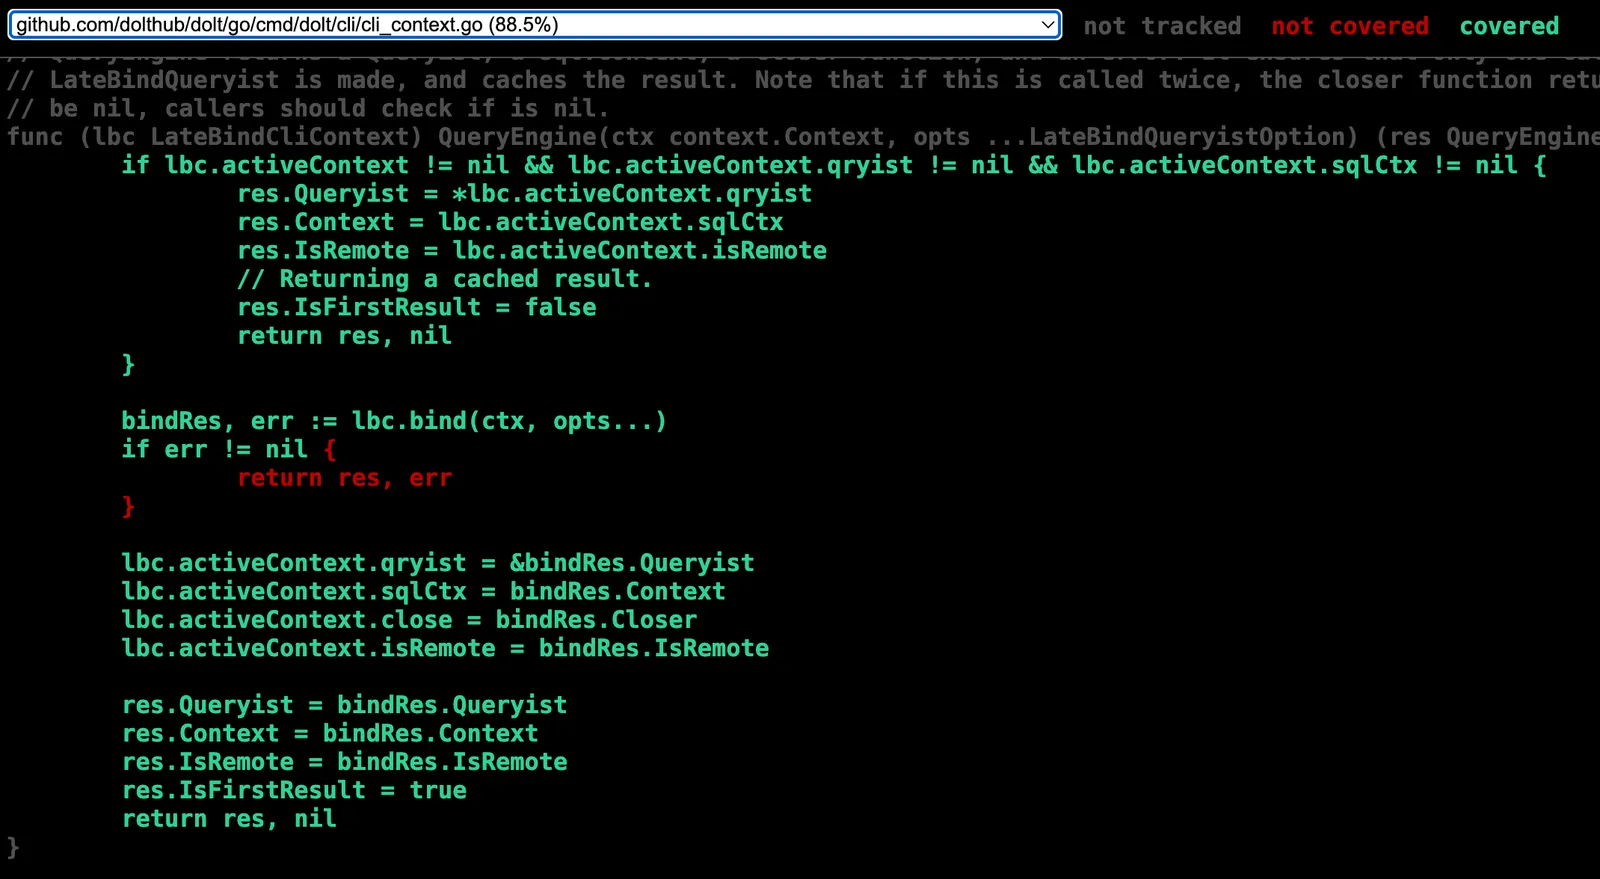
Not bad so far. But what about if I want to see coverage for a different file? No problem, just choose it from a drop-down of every file in your code base, all 1,910 of them.
I’ve seen some very clunky interfaces in my time as a software engineer but this was still
shockingly bad. Bad enough that I got Claude to write me a better one. After a few rounds of token
burn I had a little Go program that can convert the default coverage.html file and transform it
into a much more usable (and better-looking) format. It looks like this:
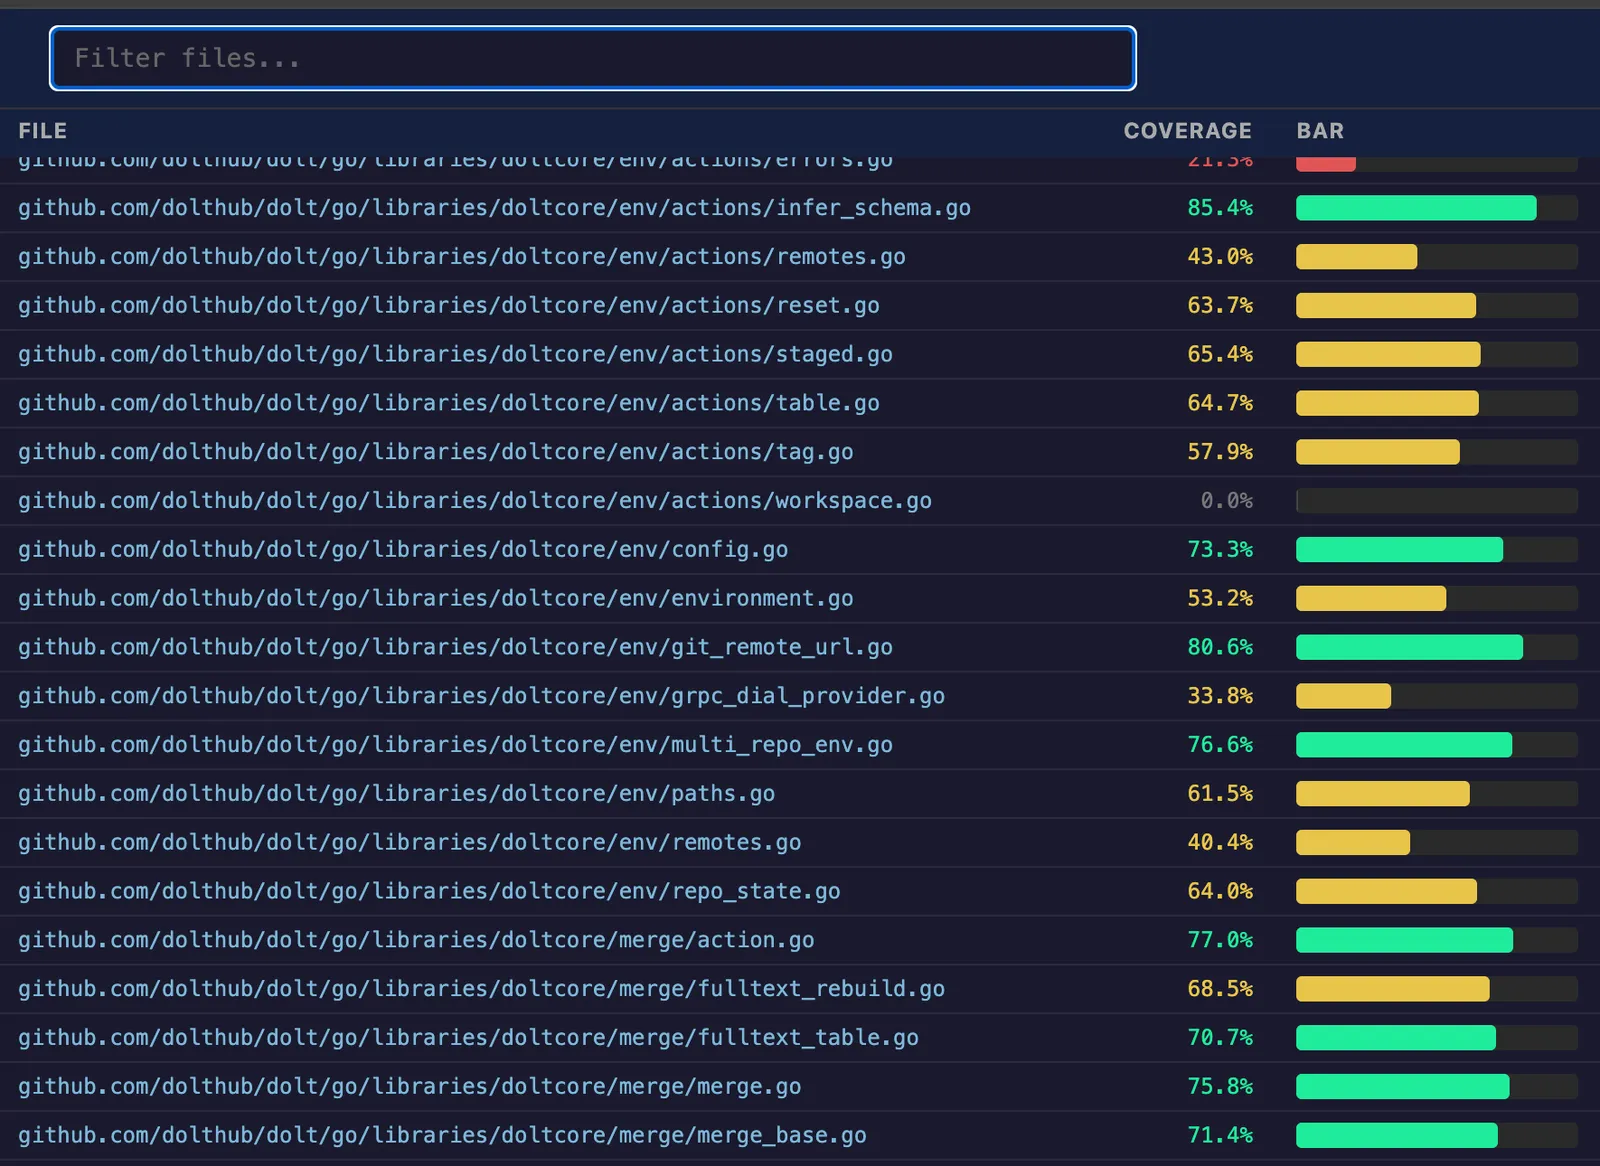
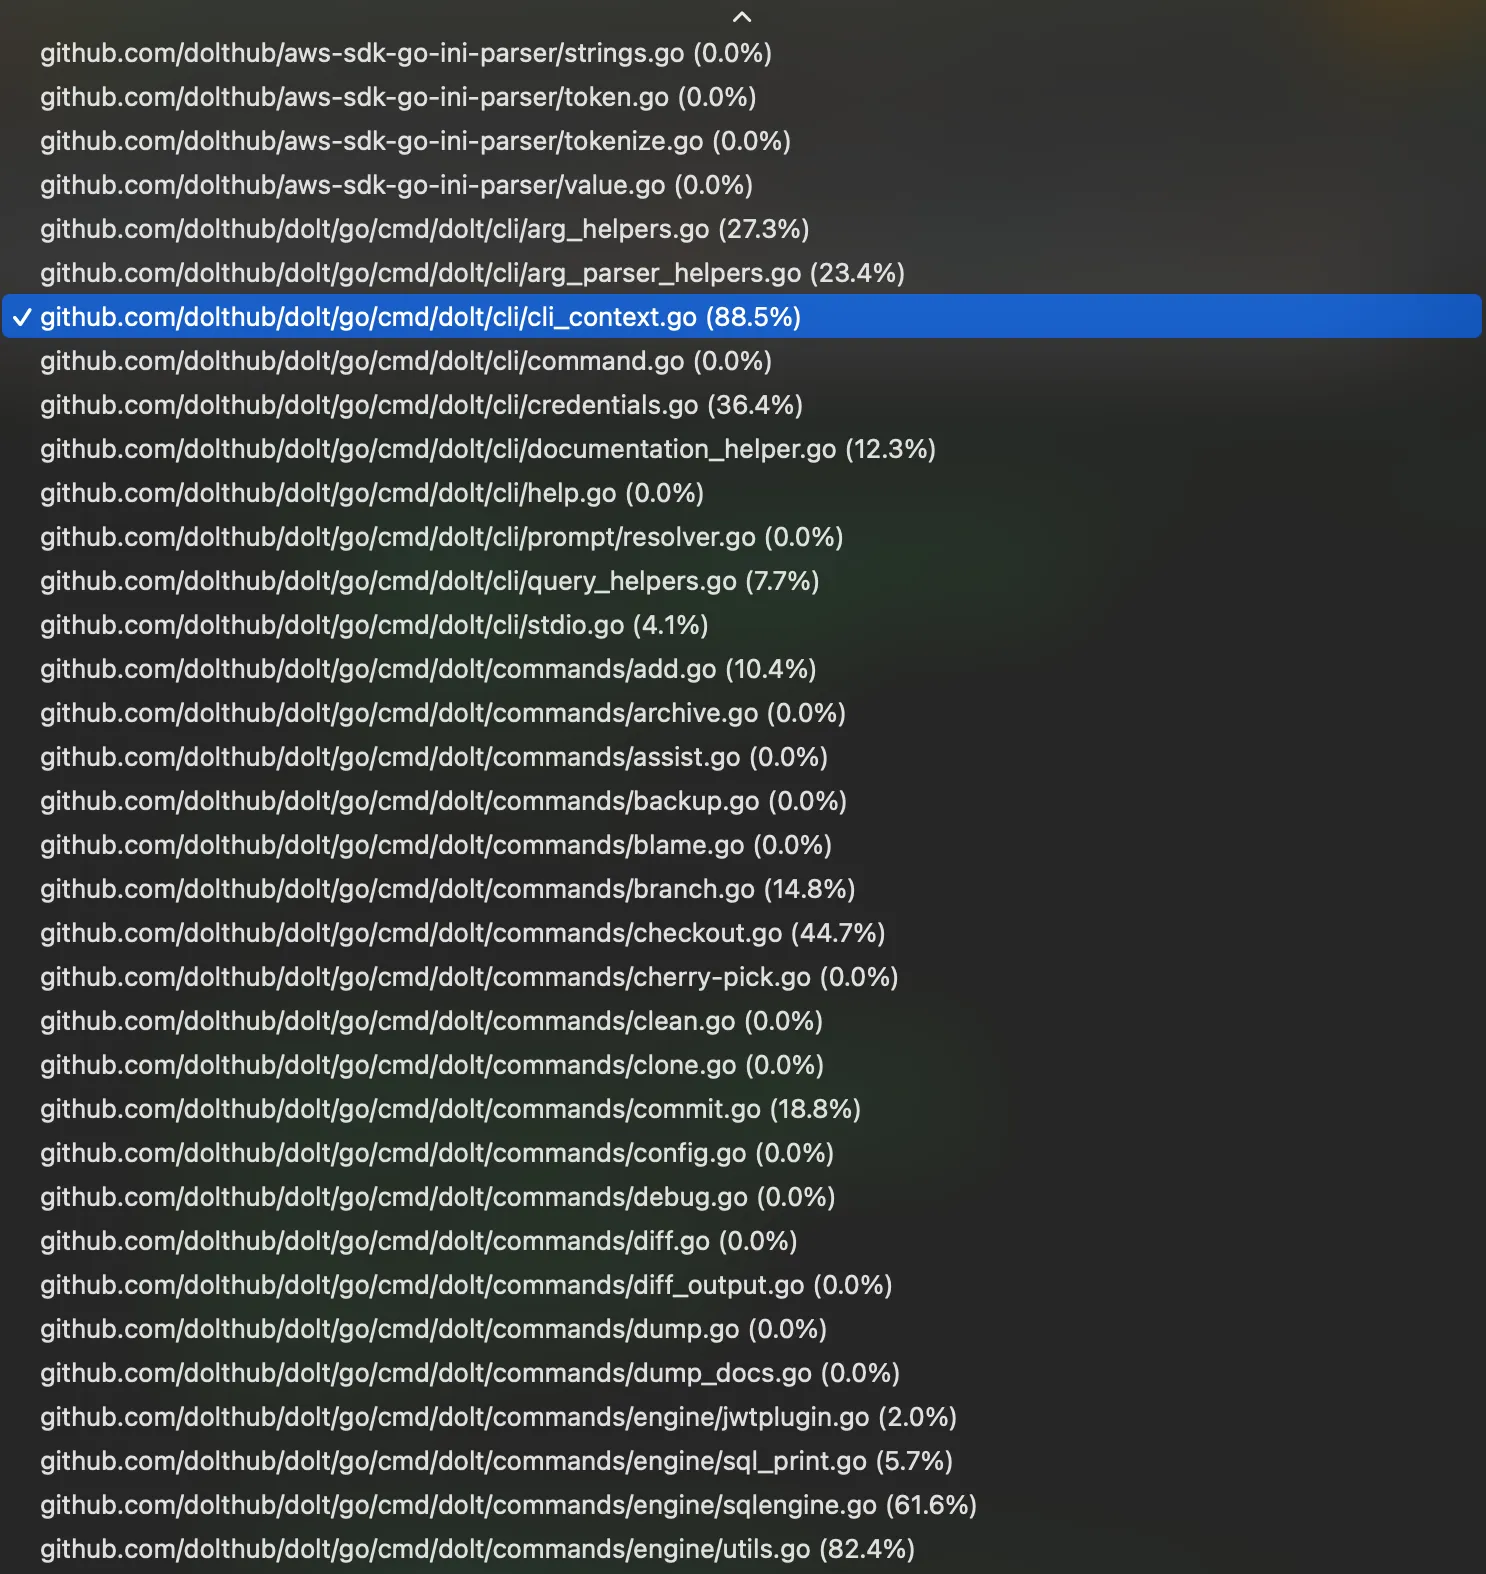
In addition to producing an index page of source code files (which you can sort by coverage amount),
it also breaks the output up into individual files stored at the same relative path as in source. I
think it’s a lot more usable than the default Go cover tool’s html output, but you be the
judge. In the era of disposable one-off AI-written tools we’re not going to publish this one as an
open source project, but if you want to try it out you can find it
here.
Putting it all together in continuous integration#
After getting a format I was satisfied with, I next asked Claude to modify our existing
.github/workflow files to produce coverage information on all test executions, sharing with the
robot the knowledge I had gleaned on how to do this. The only interesting part of this is the use of
the upload-artifact action, which looks like this:
- name: Upload coverage data
  if: always()
  uses: actions/upload-artifact@v4
  with:
    name: coverage-bats-unix
    path: /tmp/coverdata
    retention-days: 5
Now we can download the coverage information from each workflow, unzip them locally, and run the commands above to generate a coverage report. With a little more effort, we could write additional GitHub workflows to collect coverage from each PR’s test runs and create coverage reports automatically, or even gate releases on coverage information. But after very little internal discussion we decided not to bother.
Results and discussion#
Our final report has 1,910 files analyzed with an average coverage of 49%. This was a somewhat surprising result, and is lower than Java projects I’ve worked on in the past, where 70% was a typical benchmark for good testing practices. But this is a large code base, and a spot check confirms that our average is being dragged down by the inclusion of forked dependencies we use only a small part of (e.g., Vitess), a fair amount of dead code (we’re working on it), and a lack of tests for code-heavy but auto-generated features that no one uses (200 lines of untested Esperanto collation logic). I also was a bit too lazy during this experiment to instrument a few of the harder-to-change test run locations, such as our 5.7 million SQL correctness tests. So while it would take a bit more analysis to be more certain, overall I’m happy with this level of coverage and it’s in line with my expectations.
After figuring out how to produce pretty HTML coverage reports for our source code, I shared them with the team, and nobody cared. Nobody was excited to take the information provided by the report and write more tests to shore up coverage. Nobody had much to say about the results one way or another — they were far more intrigued about the AI tool used to generate them.
I think there are a few reasons for this.
- Our code base is large: 1,910 non-test Go files analyzed, comprising over a half million lines of code. Choosing where to begin shoring up coverage after eight years of not caring is a daunting task. Where do you even begin? If we had been getting coverage reports and working to improve them from the beginning, this would be a different story. But as things stand, it would be an expensive project to bootstrap.
- Go code produces a lot of red herrings in coverage info because of how errors work. Most
if err != nilblocks generates at least one uncovered statement, and they are not optional. It’s just not reasonable to expect to hit not only every error case (including very unusual and hard-to-trigger errors), but every possible path that each error can take when flowing back up the stack. This means that you can usually use very low coverage as a signal that a source file is not being tested well, or very high coverage as a signal that it’s well covered. But anything in between can have its signal-to-noise ratio reduced by the presence of error handling. Because some source files have much more error handling than others, this makes it difficult to tell at a glance where to apply coverage effort for anything in the middle range of coverage. - We feel pretty good about our overall database correctness because of metrics that are completely independent of code coverage. It’s not clear why we would begin to prioritize this new metric instead of our existing, very robust correctness suites.
Given this reality, we opted not to automate the production of these coverage reports. It would amount to a continually blaring false alarm that everyone learned to ignore, which is far worse than no information at all. But in the brave new world of coding agents, we might revisit this decision in the near future. “Hey Claude, find some high-impact libraries with poor coverage and write more unit tests!”
Conclusion#
This was an interesting experiment in how Go handles test coverage. I’m pretty happy with the tools available to combine coverage from across runs into a single report, even if the default report format is hard to use. For now, we’ve decided to continue not caring about code coverage, but we might change our minds and throw some agents at the problem in the future.
Does this match your own experience with code coverage tools in Go? Are we writing off coverage too casually? Did we get something wrong here? Visit us on the DoltHub Discord, where our engineering team hangs out all day to let us know. Hope to see you there.