
We’re hard at work on compatibility for
Doltgres, the world’s first and only
version-controlled Postgres-compatible SQL database. This means getting it to work with every
library and tool that Postgres works with, out of the box. Lately we’ve been focussing a lot of
effort on SQLAlchemy, a popular ORM for Python. Their MySQL
integration works flawlessly with Dolt, but their Postgres version is apparently completely
different, relying heavily on the pg_catalog tables. A customer tried it out and found a lot of
gaps owing to Doltgres not including system
tables (e.g. dolt_log) in the pg_catalog tables. So I fixed that, but this led to a mysterious
performance regression in one of our test suites, over a 3x slowdown.
It took quite a bit of puzzling to figure out why such an innocuous seeming change caused such a
dramatic difference in performance. In the end, what helped the most was an amazing tool in the Go
toolchain: visualizing the difference between two performance profiles with the -base option to
pprof.
Getting two profiles to diff with pprof#
Go ships with a robust profiling tool, pprof. Unlike some other languages, you have to explicitly
enable it in your code to get a profile; you can’t do it after the fact or with command line
flags. This is easy, but you have to write the code to do it. In our case, I placed it directly in
the test method being profiled.
func TestRegressionTests(t *testing.T) {
	// We'll only run this on GitHub Actions, so set this environment variable to run locally
	if _, ok := os.LookupEnv("REGRESSION_TESTING"); !ok {
		// t.Skip()
	}

	p := profile.Start(profile.CPUProfile)
	defer p.Stop()
The final two lines of this snippet start a CPU profile, then stop it when the method completes. It
uses the github.com/pkg/profile package, which provides a more ergonomic wrapper around the
built-in profiler libraries. If you run code that does this, you’ll see an output line like the
following:
2025/06/20 14:10:40.548730 profile: cpu profiling disabled, C:\Users\ZACHMU~1\AppData\Local\Temp\profile1113350212\cpu.pprofThis is the location of the profile produced by the run, which you should note or copy into another location with an easier to remember name.
For my testing, I wanted to see how the performance changed between what was on the main branch
and my current branch, so I ran the test with profiling enabled on each branch. Now I can compare
them using the -base flag with pprof.
Examining the performance diff#
After getting a profile for each branch, now I just need to compare them.
go tool pprof -http=:8090 -base main.pprof branch.pprofThe -base flag tells pprof to “subtract” the named profile from the other one when reporting
performance numbers. In this case, I want to see what is happening in branch.pprof but not in
main.pprof that’s taking so long. I also always use the -http flag, which runs an interactive
web server instead of a command-line interface. I find it much easier to work with when
investigating performance profiles.
When I run the command, my web browser launches to the default display, a graph of cumulative CPU samples roughly topo-sorted by function, so you can see what calls what. Unlike in a normal profile analysis, the numbers shown are strictly the diff between the two profiles, rather than their absolute runtimes. Here’s what I saw in my web view:
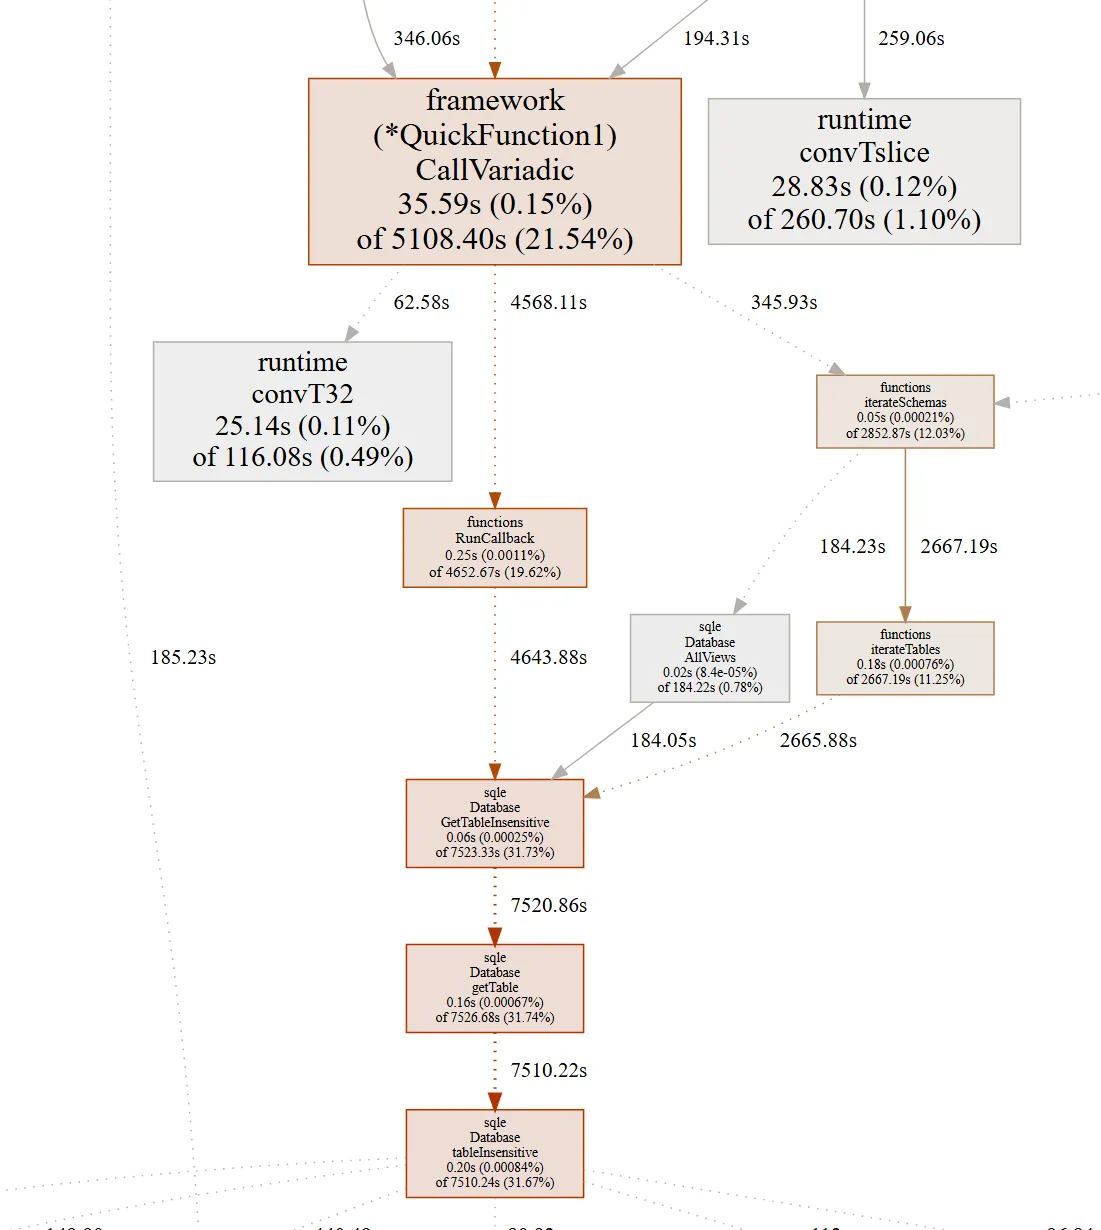
Database.tableInsensitive is the function that fetches a table object for the query engine to
use. Somehow, my changes had made this function much, much slower, despite not editing it
directly. With this clue in hand, I was able to find the performance bug.
// from tableInsensitive()

    ...

	tableNames, err := db.getAllTableNames(ctx, root, true)
	if err != nil {
		return doltdb.TableName{}, nil, false, err
	}

	if root.TableListHash() != 0 {
		tableMap := make(map[string]string)
		for _, table := range tableNames {
			tableMap[strings.ToLower(table)] = table
		}
		dbState.SessionCache().CacheTableNameMap(root.TableListHash(), tableMap)
	}

	tableName, ok = sql.GetTableNameInsensitive(tableName, tableNames)
	if !ok {
		return doltdb.TableName{}, nil, false, nil
	}
The first line of the snippet loads all table names from the DB if they weren’t already cached in
the session. This is necessary because our table names are stored in a case-sensitive manner, but
SQL is case-insensitive. So, as part of loading a table from the DB, we need to correct the
requested case-insensitive name from the query to the case-sensitive one for use in the storage and
I/O layer. But that call to db.getAllTableNames() includes a final parameter:
includeGeneratedSystemTables. This was hard-coded to true, which meant it was always calling the
new, more expensive method of getting a list of generated system tables, which includes potential
disk access to get the set of database schemas and then lots of iteration over them.
	schemas, err := root.GetDatabaseSchemas(ctx)
	if err != nil {
		return nil, err
	}

	// For dolt there are no stored schemas, search the default (empty string) schema
	if len(schemas) == 0 {
		schemas = append(schemas, schema.DatabaseSchema{Name: doltdb.DefaultSchemaName})
	}

	for _, schema := range schemas {
		tableNames, err := root.GetTableNames(ctx, schema.Name)
		if err != nil {
			return nil, err
		}

		for _, pre := range doltdb.GeneratedSystemTablePrefixes {
			for _, tableName := range tableNames {
				s.Add(doltdb.TableName{
					Name:   pre + tableName,
					Schema: schema.Name,
				})
			}
		}

		// For doltgres, we also support the legacy dolt_ table names, addressable in any user schema
		if UseSearchPath && schema.Name != "pg_catalog" && schema.Name != doltdb.DoltNamespace {
			for _, name := range doltdb.DoltGeneratedTableNames {
				s.Add(doltdb.TableName{
					Name:   name,
					Schema: schema.Name,
				})
			}
		}
	}
As it turns out, the hard-coded true was simply wrong — this method never needed to consider
system-generated table names. But it was a relatively harmless bug before I made the process of
generating those names more expensive, and had been in the code for years unnoticed. Changing this
value to false to remove the unnecessary work fixed the performance regression, and also sped up
Dolt’s benchmarks by a bit as well.
| read_tests | from_latency | to_latency | percent_change |
|---|---|---|---|
| covering_index_scan | 0.68 | 0.67 | -1.4 |
| groupby_scan | 19.65 | 19.29 | -1.83 |
| index_join | 2.57 | 2.52 | -1.95 |
| index_join_scan | 1.44 | 1.44 | 0.0 |
| index_scan | 30.26 | 29.72 | -1.78 |
| oltp_point_select | 0.29 | 0.28 | -3.45 |
| oltp_read_only | 5.37 | 5.28 | -1.68 |
| select_random_points | 0.61 | 0.6 | -1.64 |
| select_random_ranges | 0.64 | 0.62 | -3.13 |
| table_scan | 32.53 | 31.94 | -1.81 |
| types_table_scan | 127.81 | 125.52 | -1.79 |
I’m not sure I ever would have figured out the source of this inefficiency without the -base flag
to point me in the right direction.
Conclusion#
Questions about Go performance profiling or about Doltgres? Come by our Discord to talk to our engineering team and meet other Doltgres users.