
At DoltHub, we bring version control to databases. Dolt is a MySQL compatible database with Git-like functionality, and Doltgres brings that same version control functionality to a Postgres compatible database. Whether you choose Dolt, Doltgres, or any other database to back your application, you will want to monitor it to make sure it’s behaving as expected.
Prometheus is a popular open-source metrics toolkit with countless plugins and adapters for interoperability with other metrics, monitoring, and alerting software. Dolt and Doltgres publish metrics in Prometheus’ metrics format in a way that can be consumed easily by a Prometheus compatible metrics collector.
In this blog I’ll go over setting up both Dolt and Doltgres metrics publishing, then cover configuring a Prometheus metrics collector as well as how to query the metrics data to see a visualization of your metrics.
Publishing Metrics with Dolt and Doltgres#
Both Dolt and Doltgres publish metrics by creating an http server which can be used to scrape metrics. To turn on this endpoint you’ll need to alter the config file used to configure your database. In either case you will want to add the following lines to your servers yaml config file:
metrics:
  host: "0.0.0.0"
  port: 8000
That’s all you need to do. These lines will allow connections coming to any of the network interfaces on port 8000. Once
you start your server you can view the metrics by simply opening your browser to http://127.0.0.1:8000/metrics where
you should see something like:
# HELP dss_concurrent_connections Number of clients concurrently connected to this instance of dolt sql server
# TYPE dss_concurrent_connections gauge
dss_concurrent_connections 0
# HELP dss_concurrent_queries Number of queries concurrently being run on this instance of dolt sql server
# TYPE dss_concurrent_queries gauge
dss_concurrent_queries 0
# HELP dss_connects Count of server connects
# TYPE dss_connects counter
dss_connects 0
# HELP dss_disconnects Count of server disconnects
# TYPE dss_disconnects counter
dss_disconnects 0
# HELP dss_dolt_version The version of dolt currently running on the machine
# TYPE dss_dolt_version gauge
dss_dolt_version 2.025063e+07
# HELP dss_query_duration Histogram of dolt sql server query runtimes
# TYPE dss_query_duration histogram
dss_query_duration_bucket{le="0.01"} 0
dss_query_duration_bucket{le="0.1"} 0
dss_query_duration_bucket{le="1"} 0
dss_query_duration_bucket{le="10"} 0
dss_query_duration_bucket{le="100"} 0
dss_query_duration_bucket{le="1000"} 0
dss_query_duration_bucket{le="+Inf"} 0
dss_query_duration_sum 0
dss_query_duration_count 0

# Many more lines are published.  Truncated for brevity
Of course, you may want to run your metrics server on a different port or limit the network interfaces used to connect to the metrics server. Your yaml config file gives you control over the interface and port used to publish metrics.
Scraping Metrics#
Now that metrics are being published from your database, I would suggest that you visit the official Prometheus Getting Started page and use that as your initial guide. Once you’ve done that, you’ll have Prometheus up and running scraping metrics, and an interface for accessing your data.
After you have that running, you’ll need to alter the prometheus.yml file that you created while going through the Prometheus Getting Started guide. You will add a second scraping job making sure the target used here matches the host and port setup in our database’s config file.
- job_name: "dolt"
  scrape_interval: 5s

  static_configs:
    - targets: ["localhost:8000"]
Useful Metrics#
Dolt and Doltgres are Golang applications, and the standard
Golang Prometheus metric server that Dolt(gres) uses provides some basic process level metrics. These metrics begin with the
prefix process_ (they are not available when Dolt is run on MacOS). A useful example is
process_cpu_seconds_total. This metrics gives you the amount of cpu time used by the process. The other process level metrics exported are:
process_cpu_seconds_total
process_max_fds
process_open_fds
process_resident_memory_bytes
process_start_time_seconds
process_virtual_memory_bytes
process_virtual_memory_max_bytes
Metrics beginning with the prefix go_ are metrics from the go runtime that are available on all platforms. If
you want to know how much memory has been used, go_memstats_heap_alloc_bytes is the number of heap bytes allocated
and still in use. A full list of the exposed go metrics are:
go_gc_duration_seconds
go_goroutines
go_info
go_memstats_alloc_bytes
go_memstats_alloc_bytes_total
go_memstats_buck_hash_sys_bytes
go_memstats_frees_total
go_memstats_gc_sys_bytes
go_memstats_heap_alloc_bytes
go_memstats_heap_idle_bytes
go_memstats_heap_inuse_bytes
go_memstats_heap_objects
go_memstats_heap_released_bytes
go_memstats_heap_sys_bytes
go_memstats_last_gc_time_seconds
go_memstats_lookups_total
go_memstats_mallocs_total
go_memstats_mcache_inuse_bytes
go_memstats_mcache_sys_bytes
go_memstats_mspan_inuse_bytes
go_memstats_mspan_sys_bytes
go_memstats_next_gc_bytes
go_memstats_other_sys_bytes
go_memstats_stack_inuse_bytes
go_memstats_stack_sys_bytes
go_memstats_sys_bytes
go_threads
Dolt(gres) metrics use the prefix dss_ and an example metric would be dss_concurrent_queries which will give
you the number of queries being run by the server at any moment. The full list of dss metrics are:
dss_concurrent_connections
dss_concurrent_queries
dss_connects
dss_disconnects
dss_dolt_version
dss_query_duration_bucket
Graphing Some Metrics#
If you go back to the Prometheus graphing interface you used when going through the Prometheus Getting Started
guide, you can visualize these metrics. We’ll simply start by querying the go_memstats_heap_alloc_bytes.
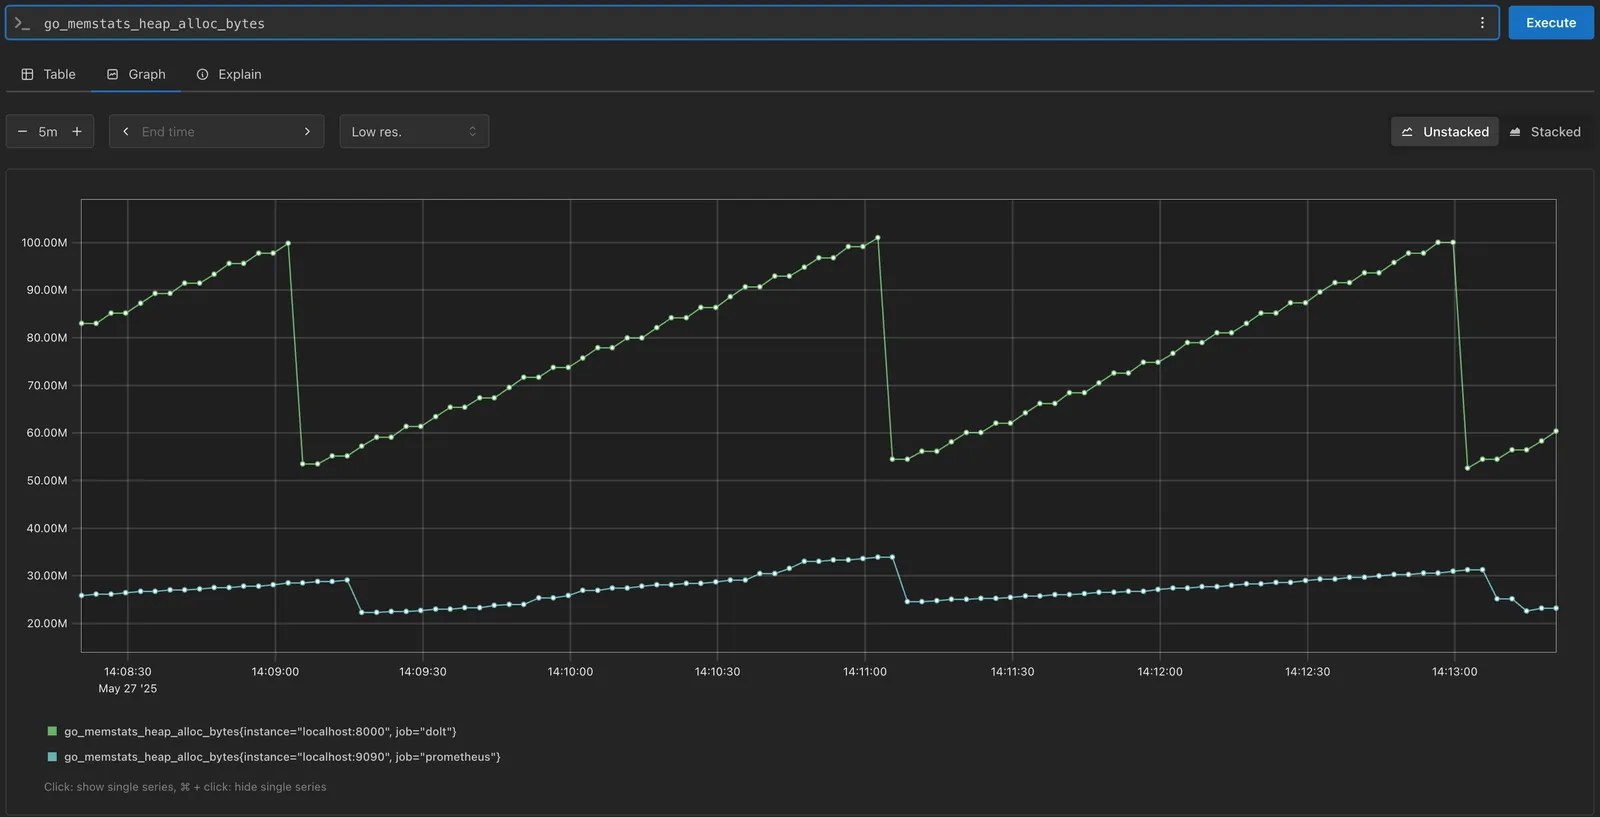
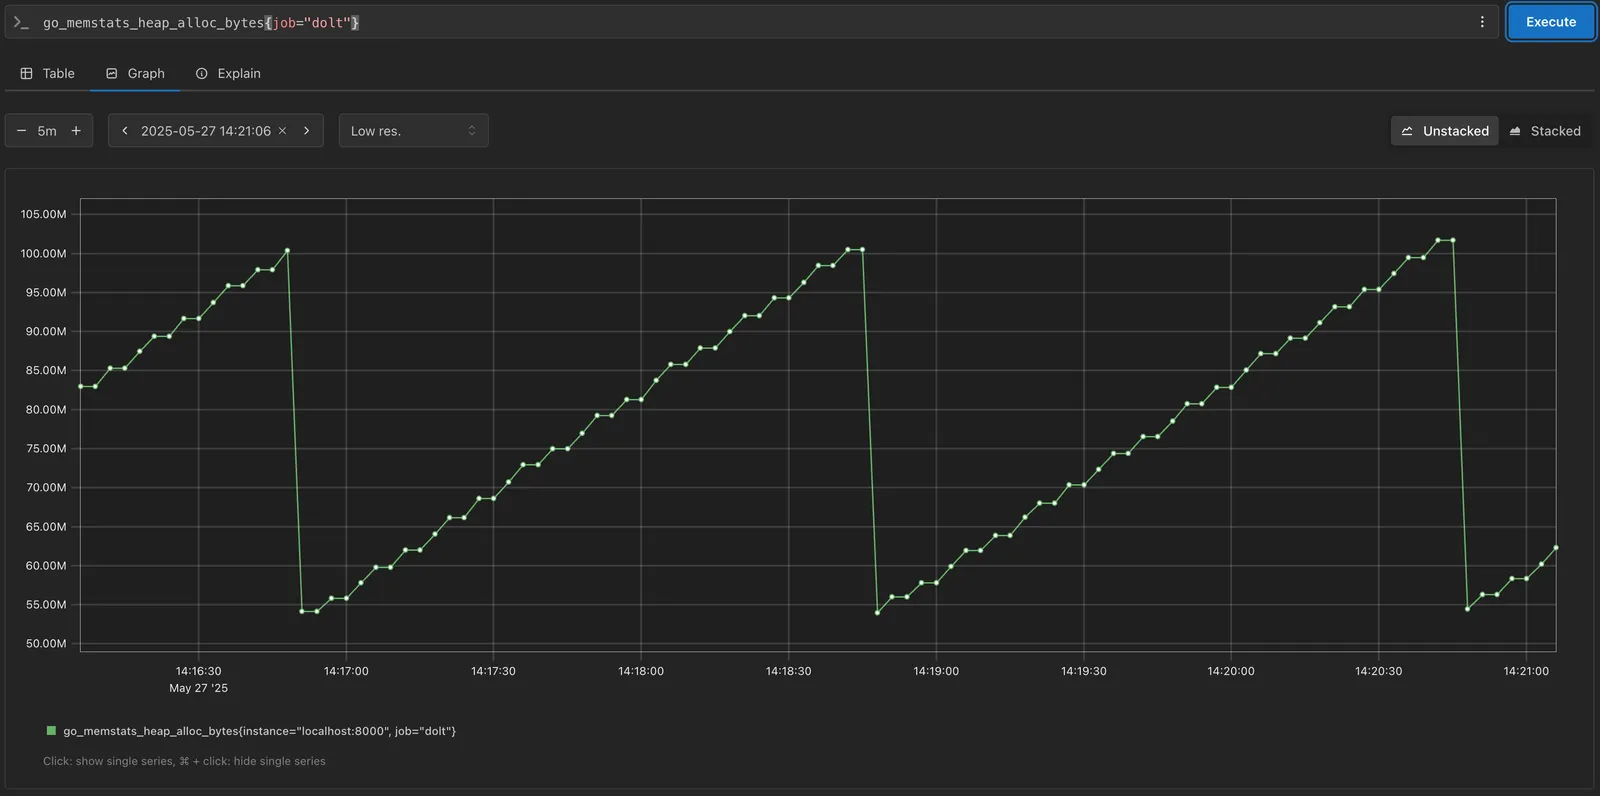
Here you can see that both the “dolt” and “prometheus” scraping jobs have values for that metric. If we then want to limit
our graph to just the dolt job you can alter your query to be go_memstats_heap_alloc_bytes{job="dolt"}
Next you can look at the query performance for your server. Dolt publishes dss_query_duration_bucket which is a histogram
which buckets query times into buckets.
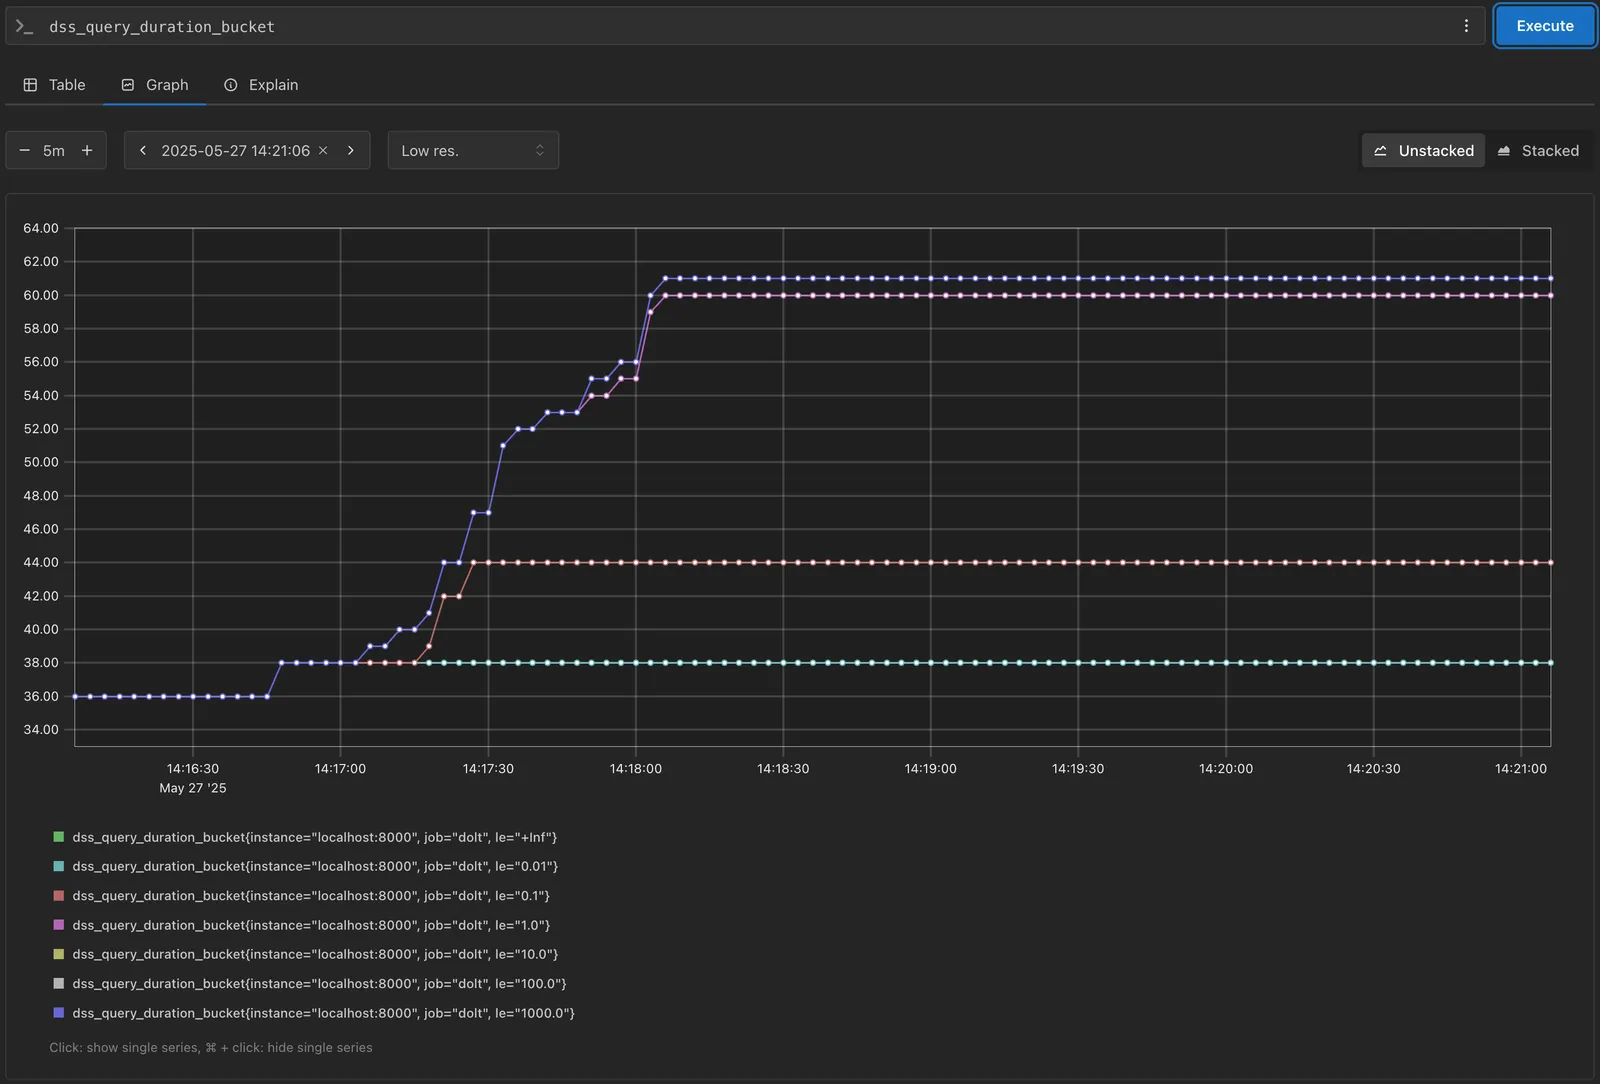
The graph above shows the number of queries that occurred for each duration bucket. Each query will be counted one time for each of the buckets where the query time is less than the upper limit of that bucket. So a query that took half a second will be counted in the 1s, 10s, 100s 1000s, and Infinite buckets.
The visualizations I presented are very simple metrics, but prometheus has a lot of power and flexibility using PromQL (Prometheus Query Language). I won’t dive into all the functions and operations available to gain insights from your raw metric data. However, the official PromQL documentation is a great resource, and there are numerous articles on the web to help you get the most value from your data.
Conclusion#
Both Dolt and Doltgres support Prometheus metrics for monitoring your database server. If you have questions about using Dolt(gres) with Prometheus visit us on Discord.