
Introduction#
We’re building Dolt, the world’s first version-controlled SQL database. We measure Dolt’s performance with sysbench, an industry standard set of SQL benchmarks that you can use to get an apples-to-apples performance comparison of the same workload on different database products. Our result on these benchmarks indicate that Dolt currently has about twice the latency of MySQL.
We recently noticed that the upcoming release of Go 1.22 features improvements in profile-guided optimization, or PGO, which was originally released in Go 1.21. We decided to see how much of a difference this new feature made to Dolt’s SQL benchmarks. Our initial results are below: about a 5% decrease in read latency, and a 1.5% decrease in write latency. Keep reading for more details.
| Read Benchmark | Median latency, no PGO | Median latency with PGO | % Reduction |
|---|---|---|---|
| covering_index_scan | 2.86 | 2.57 | 10.14% |
| groupby_scan | 17.63 | 16.41 | 6.92% |
| index_join | 5.18 | 4.91 | 5.21% |
| index_join_scan | 2.18 | 2.14 | 1.83% |
| index_scan | 63.32 | 57.87 | 8.61% |
| oltp_point_select | 0.46 | 0.46 | 0.00% |
| oltp_read_only | 8.13 | 7.84 | 3.57% |
| select_random_points | 0.75 | 0.75 | 0.00% |
| select_random_ranges | 0.9 | 0.86 | 4.44% |
| table_scan | 63.32 | 57.87 | 8.61% |
| types_table_scan | 170.48 | 155.8 | 8.61% |
| Average | 5.27% |
| Write Benchmark | Median latency, no PGO | Median latency with PGO | % Reduction |
|---|---|---|---|
| oltp_delete_insert | 5.99 | 5.88 | 1.84% |
| oltp_insert | 2.97 | 2.91 | 2.02% |
| oltp_read_write | 15.27 | 15 | 1.77% |
| oltp_update_index | 3.13 | 3.07 | 1.92% |
| oltp_update_non_index | 3.07 | 3.02 | 1.63% |
| oltp_write_only | 7.43 | 7.3 | 1.75% |
| types_delete_insert | 6.67 | 6.67 | 0.00% |
| Average | 1.56% |
What is profile-guided optimization?#
Profile-guided optimization (PGO) is a feature of the Go compiler since 1.21 that uses the result of a profile run to optimize the binary being built. Essentially: the compiler looks at your profile for hotspots and inlines code (and makes other optimizations) where it could help performance.
To enable PGO, you first need to generate a profile for your application. Unlike some other languages, Go requires you to build profiling code into your application ahead of time. Here’s a simple example:
import (
    "github.com/pkg/profile"
)

func main() {
    defer profile.Start(profile.CPUProfile,
        profile.NoShutdownHook).Stop()
    mainLogic()
}
In your application, you should trigger running the profiler with a command line flag or some other cue — you don’t want it on during normal use. For Dolt, we chose to use a flag like so:
func main() {
    args := os.Args[1:]
    if len(args) > 0 {
        switch args[0] {
        case profFlag:
            switch args[1] {
            case cpuProf:
                defer profile.Start(profile.CPUProfile, profile.NoShutdownHook).Stop()
            case memProf:
                defer profile.Start(profile.MemProfile, profile.NoShutdownHook).Stop()
            }
            // several more cases for other profile types
            args = args[2:]
        }
    }
}
If I want to take a profile of the SQL server, I invoke it like so:
$ dolt --prof cpu sql-server
cpu profiling enabled.
2024/01/31 20:31:00 profile: cpu profiling enabled, /tmp/profile2071582115/cpu.pprof
Starting server with Config HP="localhost:3306"|T="28800000"|R="false"|L="info"|S="/tmp/mysql.sock"
INFO[0001] NewConnection                                 DisableClientMultiStatements=false connectionID=1
INFO[0031] ConnectionClosed                              connectionID=1
^CINFO[0033] Server closing listener. No longer accepting connections.
2024/01/31 20:31:34 profile: cpu profiling disabled, /tmp/profile2071582115/cpu.pprof
You can see we’ve also instrumented the server to log the location of the profile file it produces so that we can inspect it after the run.
Once I have the profile, I can feed it into the go compiler with the pgo flag like so:
$ go build -pgo=./cpu.pprof .And that’s it! The Go build will take a bit longer than usual, but will produce a binary optimized according to the profile you fed it.
Initial experimental setup and result#
All experiments were run on an m5a.4xlarge EC2 instance in us-west-2 running Ubuntu 22.04.3.
To get an initial profile, I started the unmodified dolt binary with CPU profiling enabled and hit
it with the sysbench tool, specifically the
oltp_read_write benchmark, one of the more balanced of the simple benchmarks and hopefully
reasonably representative of actual database traffic in production. Go’s documentation on
PGO warns:
For best results, it is important that profiles are representative of actual behavior in the application’s production environment. Using an unrepresentative profile is likely to result in a binary with little to no improvement in production. Thus, collecting profiles directly from the production environment is recommended, and is the primary method that Go’s PGO is designed for.
We didn’t have a true production environment we could easily enable this experiment on, so a benchmark was a good compromise. And since we’ll be measuring our performance improvements against that same benchmark, it should be fair enough to get an idea how well the optimizations work.
Starting the server:
$ dolt --prof cpu sql-serverHitting it with traffic:
$ sysbench --db-driver=mysql --time=30 --mysql-host=127.0.0.1 \
    --mysql-user=root  --db-ps-mode=disable --percentile=50 \
    oltp_read_write run
And building the PGO binary:
$ go build -pgo=./cpu.pprof .Now we’re ready to do some performance comparisons with the new binary. We run the benchmark as
before, with the new binary and old binary. We’ll run each one three times, then examine the
results. sysbench outputs results that look like this:
SQL statistics:
    queries performed:
        read:                            23520
        write:                           6720
        other:                           3360
        total:                           33600
    transactions:                        1680   (55.97 per sec.)
    queries:                             33600  (1119.45 per sec.)
    ignored errors:                      0      (0.00 per sec.)
    reconnects:                          0      (0.00 per sec.)

General statistics:
    total time:                          30.0128s
    total number of events:              1680

Latency (ms):
         min:                                   16.01
         avg:                                   17.86
         max:                                  421.03
         50th percentile:                       17.32
         sum:                                30006.57

Threads fairness:
    events (avg/stddev):           1680.0000/0.00
    execution time (avg/stddev):   30.0066/0.00
Once we have a bunch of files of results for each binary, we can pull out the relevant numbers and plot them. The bottom line for us, as a database, is transactions per second (tps) and median latency. Here’s how those compare between the unoptimized and optimized binaries:
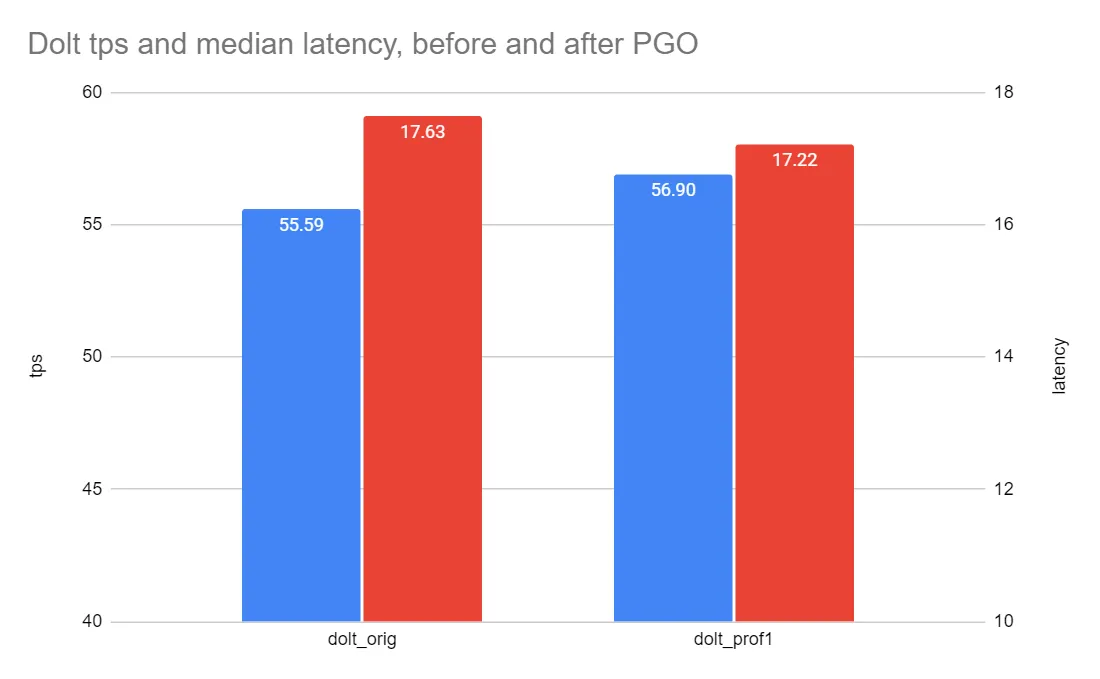
So PGO increased transactions per second on this benchmark from 55.59 tps to 56.90 tps, an increase of 2.4%. Meanwhile median latency reduced from 17.63 ms to 17.22 ms, a reduction of 2.3%. This isn’t an overwhelming improvement in performance, but we didn’t have to make any code changes to get it, and it’s well within the Go team’s guidance of 2-8%. Not bad!
So what’s it doing?#
It’s natural to ask, where are the performance benefits coming from? What’s different between the unoptimized binary and the optimized one? The docs give us some clues:
Profile-guided optimization (PGO), also known as feedback-directed optimization (FDO), is a compiler optimization technique that feeds information (a profile) from representative runs of the application back into to the compiler for the next build of the application, which uses that information to make more informed optimization decisions. For example, the compiler may decide to more aggressively inline functions which the profile indicates are called frequently. (emphasis mine)
And indeed, if we compare the size of the binary before and after optimization, we can see that it grew by 530k, a little over 4%.
$ ls -la
-rwxrwxr-x  1 ubuntu ubuntu 121154086 Jan 30 23:26 dolt-orig
-rwxrwxr-x  1 ubuntu ubuntu 121697580 Jan 31 00:29 dolt-prof-1
This is a good indication that inlining has taken place: the instructions from inlined functions get moved into the bodies of their call sites, which inflates the size of the compiled binary.
We can also compare what’s different using profiles collected from the two binaries. pprof has the
ability to compute the difference between two profiles using the -diff_base flag:
/usr/local/go/bin/go tool pprof -http=:8090 -diff_base=cpu-orig-30.prof cpu-prof-30.profWhen we inspect this result, we can use the top view to see where the savings come from. First
let’s sort by Flat%, which tells us where the runtime is spending fewer cycles:
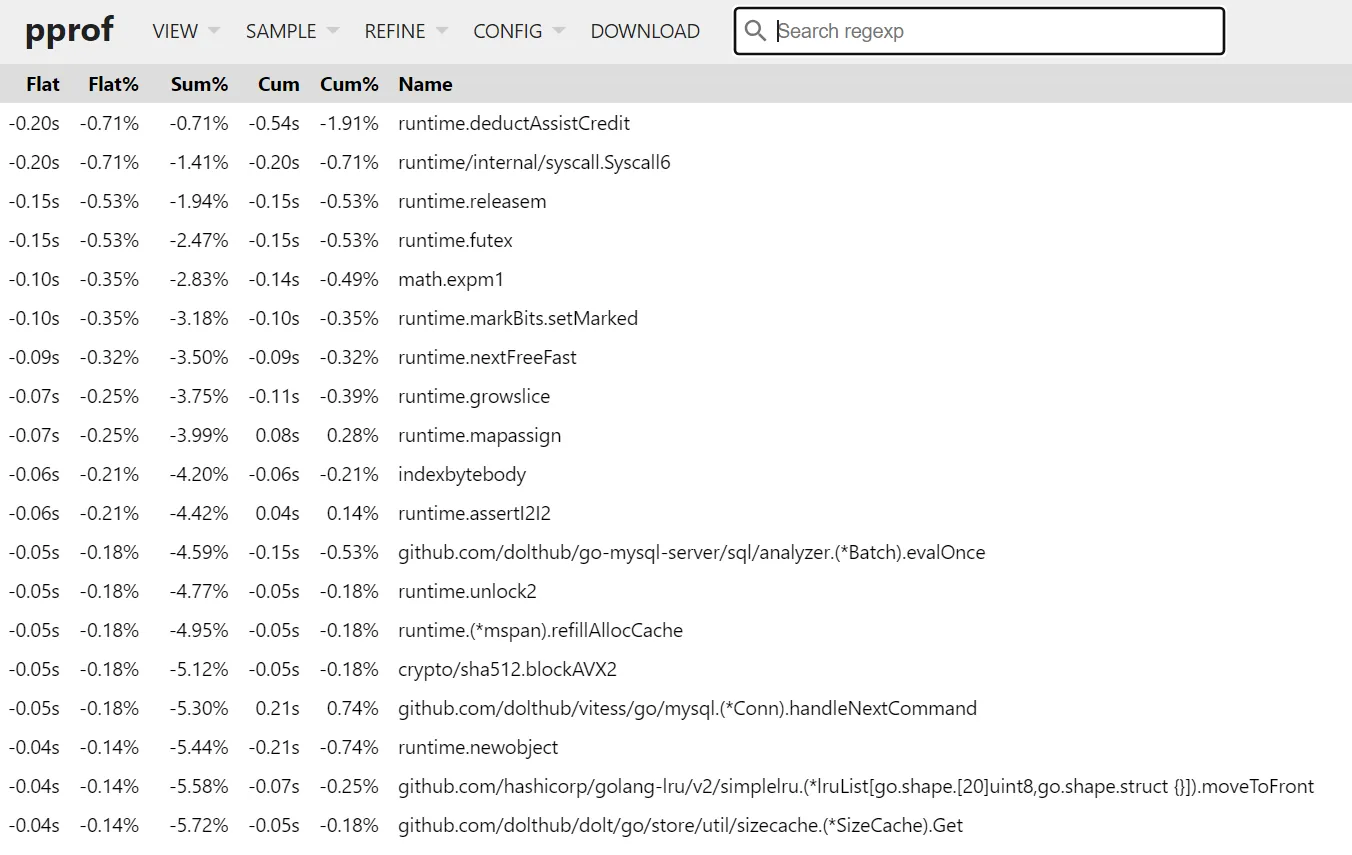
Almost none of this is our code, it’s all stuff from the runtime. This is more or less expected:
these are the low-level calls that are getting inlined into their call sites. Of special note here
is crypto/sha512.blockAVX2, which we use in a lot of places to compute the hashes of data
structures.
To get a slightly different view, we can sort by Cum%, which gives us the transitive savings of
the call sites themselves, which is a hint to where things are being inlined.
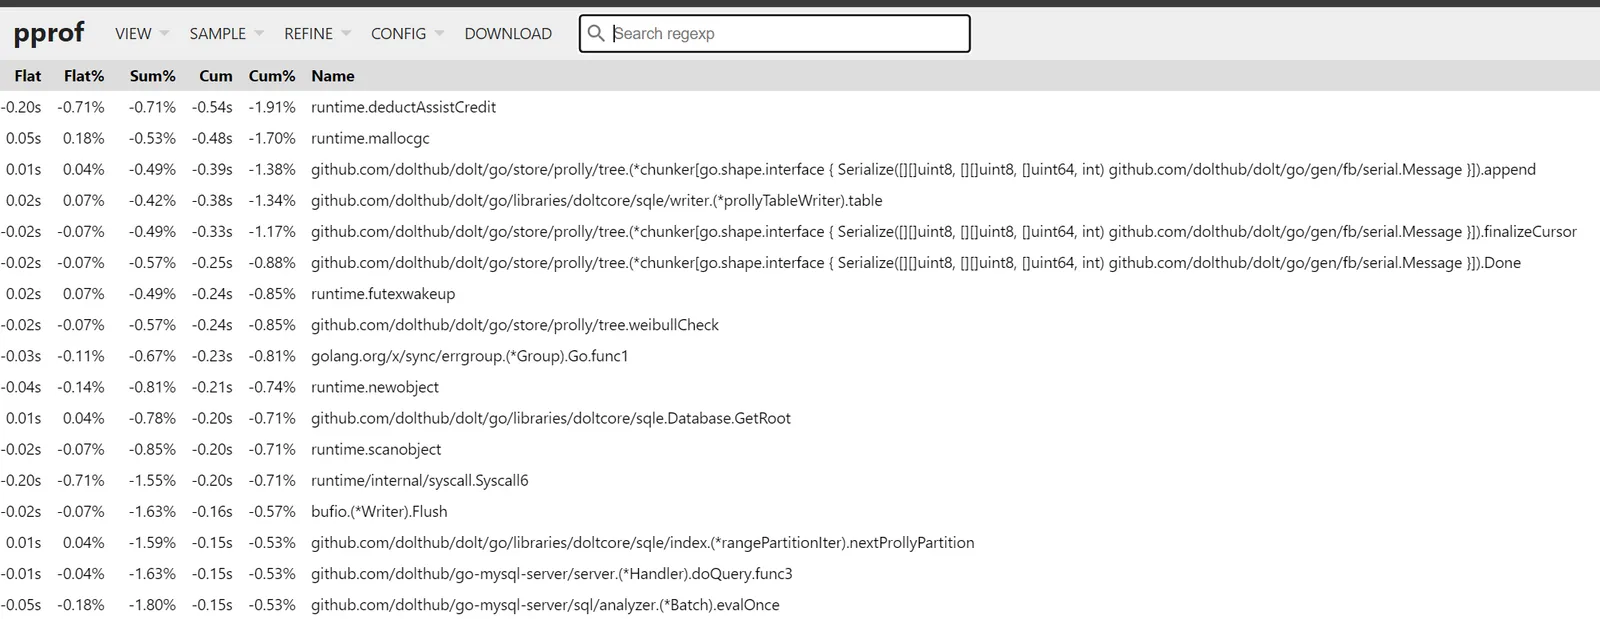
No real surprises here, but it confirms that what got faster is operations traversing the prolly tree data type, which is the data structure Dolt uses for storage.
Finally, we can look at the flame graph for a visual representation of what got faster. Remember, this is the diff between the old binary and the new one: it’s showing where CPU time changed, not total time.
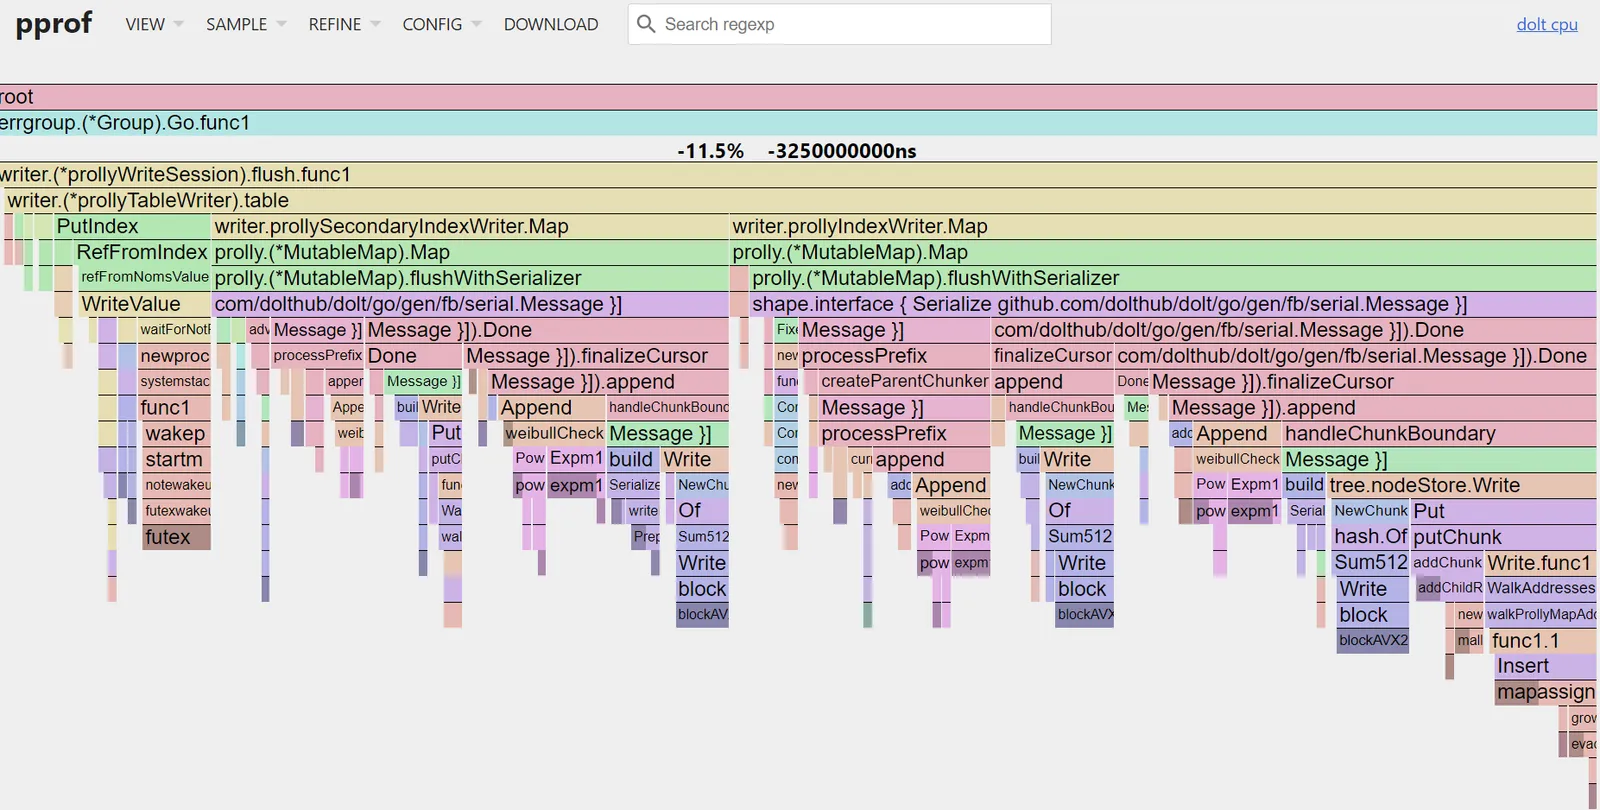
This gives us a high-level view of what’s changed. You can see at a glance that nearly all of the
performance savings come from write operations, writer.prollyTableWriter and friends. Within those
operations, you can further see large savings from the crypto/sha512 package, colored in dark blue
near the bottom of the flame chart in several places. The Sum512 function and helpers appear to
have been inlined at several call sites on the hot path. You can also see that in the Weibull check
algorithm (light orange) various math operations like Pow (hot pink) appear to have been inlined
as well.
To go much deeper than this you would probably need to decompile the binaries and compare them directly, which would be interesting but is a little out of scope for this blog.
Can we go deeper? Profiler-ception?#
The PGO docs indicate that it’s built to be run iteratively:
The typical workflow is as follows:
- Build and release an initial binary (without PGO).
- Collect profiles from production.
- When it’s time to release an updated binary, build from the latest source and provide the production profile.
- GOTO 2
So, being a disagreeable asshole, the very first thought I had was “what happens if I run this on the same binary, no source changes, for several cycles?” Do I get infinite performance improvements? Can I break it?

So I did that, for 3 cycles. Even before examining the benchmark results, you can tell it’s doing something, because the size of the binary kept changing:
$ la -la
-rwxrwxr-x  1 ubuntu ubuntu 121154086 Jan 30 23:26 dolt-orig
-rwxrwxr-x  1 ubuntu ubuntu 121697580 Jan 31 00:29 dolt-prof-1
-rwxrwxr-x  1 ubuntu ubuntu 121565825 Jan 31 00:52 dolt-prof-2
-rwxrwxr-x  1 ubuntu ubuntu 121571025 Jan 31 00:54 dolt-prof-3
After initially growing by around 500k as discussed above, further iterations of the profile-optimize cycle shrank the binary a bit, then rebounded a bit. This would indicate that the compiler decided not to inline previously inlined functions after all. As for the performance, it’s not very exciting:

Further cycles of PGO without source changes don’t appreciably alter the performance profile. There’s maybe a very small improvement on the second cycle, but the third is identical. And the variations are small enough they could easily be measurement error. To be fair, the Go team anticipated this and attempted to bullet-proof the PGO process against it:
Iterative stability is the prevention of cycles of variable performance in successive PGO builds (e.g., build #1 is fast, build #2 is slow, build #3 is fast, etc). We use CPU profiles to identify hot functions to target with optimizations. In theory, a hot function could be sped up so much by PGO that it no longer appears hot in the next profile and does not get optimized, making it slow again. The Go compiler takes a conservative approach to PGO optimizations, which we believe prevents significant variance. If you do observe this kind of instability, please file an issue at go.dev/issue/new.
Judging by the changing binary sizes, the PGO process is still making some changes on the margins. But as demonstrated by the performance numbers, these are in fact marginal changes. And considering we were only dealing with a 2.4% performance increase in the first place, it would be surprising if further rounds of PGO changed it by much.
Extending the experiment to all the benchmarks#
I shared this initial result, based on a single benchmark, with the team Discord. People were a little surprised by the gains and wanted the details of how it worked. Our CEO Tim was a little more direct about what to do next:
Mostly I was curious if the single benchmark I had chosen originally would generalize to all the benchmarks. So I whipped up a little script to run them all and collect the profiles.
#!/bin/bash

tests=("covering_index_scan" "groupby_scan" "index_join"
"index_join_scan" "index_scan" "oltp_point_select" "oltp_read_only"
"select_random_points" "select_random_ranges" "table_scan"
"types_table_scan" "oltp_delete_insert" "oltp_insert"
"oltp_read_write" "oltp_update_index" "oltp_update_non_index"
"oltp_write_only" "types_delete_insert")

dolt sql -q "drop database sbtest"
dolt sql -q "create database sbtest"

for test in "${tests[@]}"; do
    echo "running $test"

    dolt sql-server &
    server_pid=$!

    echo "preparing"
    sleep 2
    sysbench --db-driver=mysql --time=10 --mysql-host=127.0.0.1 \
             --mysql-user=root  --db-ps-mode=auto --percentile=50 \
             --rand-type=uniform --table-size=10000 \
             --histogram=true "$test" prepare
    kill "$server_pid"
    wait "$server_pid"

    dolt --prof cpu sql-server >> dolt-test-output.txt 2>&1 &
    server_pid=$!

    echo "running"
    sleep 2
    sysbench --db-driver=mysql --time=60 --mysql-host=127.0.0.1 \
             --mysql-user=root  --db-ps-mode=auto --percentile=50 \
             --rand-type=uniform --table-size=10000  \
             --histogram=true "$test" run
    kill "$server_pid"
    wait "$server_pid"

    dolt sql-server &
    server_pid=$!

    echo "cleanup"
    sleep 2
    sysbench --db-driver=mysql --time=60 --mysql-host=127.0.0.1 \
             --mysql-user=root  --db-ps-mode=auto --percentile=50 \
             --rand-type=uniform --table-size=10000 \
             --histogram=true "$test" cleanup
    kill "$server_pid"
    wait "$server_pid"
done
This script starts a dolt server, runs the benchmark, and cleans up for each benchmark. I decided
that it would give me a cleaner profile if I only collected samples during the run portion of the
benchmark, not for prepare and cleanup, but in retrospect I doubt this mattered much. But
importantly, I used the same sysbench flags that are used to produce our official latency
numbers.
This produced a bunch of cpu.pprof files in various /tmp directories, so I just needed to
extract those file names from the log and them copy them into this directory so I could work with
them:
grep disabled dolt-test-output.txt | cut -d',' -f2 | tr -d ' ' > profiles.txt

while IFS= read -r filename; do
    subdirectory=$(basename "$(dirname "$filename")");
    mkdir -p "$subdirectory";
    cp "$filename" "$subdirectory/";
done < profiles.txt
You can merge different profiles together with the pprof tool like this:
$ go tool pprof -proto profile*/cpu.pprof > merged.pprofGenerally speaking you want each of the merged profiles to encompass the same wall-clock duration, since that means they will each contain the same number of samples. If some profiles are longer than others, the longer ones will be weighted heavier in the merged result. I set all my benchmarks to run for a fixed duration of 60 seconds, rather than for a fixed number of cycles, for this reason.
The simplest way to get a build that uses PGO with this merged profile is to just copy it to the
binary’s main directory and rename it default.pgo. In Go 1.21 or later, go build will
automatically use a profile with this name to optimize a build. I did this, then ran a full
benchmark comparing the old and new binaries. The results (duplicated at the beginning of the post):
| Read Benchmark | Median latency, no PGO | Median latency with PGO | % Reduction |
|---|---|---|---|
| covering_index_scan | 2.86 | 2.57 | 10.14% |
| groupby_scan | 17.63 | 16.41 | 6.92% |
| index_join | 5.18 | 4.91 | 5.21% |
| index_join_scan | 2.18 | 2.14 | 1.83% |
| index_scan | 63.32 | 57.87 | 8.61% |
| oltp_point_select | 0.46 | 0.46 | 0.00% |
| oltp_read_only | 8.13 | 7.84 | 3.57% |
| select_random_points | 0.75 | 0.75 | 0.00% |
| select_random_ranges | 0.9 | 0.86 | 4.44% |
| table_scan | 63.32 | 57.87 | 8.61% |
| types_table_scan | 170.48 | 155.8 | 8.61% |
| Average | 5.27% |
| Write Benchmark | Median latency, no PGO | Median latency with PGO | % Reduction |
|---|---|---|---|
| oltp_delete_insert | 5.99 | 5.88 | 1.84% |
| oltp_insert | 2.97 | 2.91 | 2.02% |
| oltp_read_write | 15.27 | 15 | 1.77% |
| oltp_update_index | 3.13 | 3.07 | 1.92% |
| oltp_update_non_index | 3.07 | 3.02 | 1.63% |
| oltp_write_only | 7.43 | 7.3 | 1.75% |
| types_delete_insert | 6.67 | 6.67 | 0.00% |
| Average | 1.56% |
So I’m glad I ran this experiment on the full set of benchmarks. As it turns out, my initial
experiment with only oltp_read_write understated the benefit of PGO. For reasons that require more
investigation, the write-heavy benchmarks saw less improvement than the read-only ones. But most
real-world workloads are also dominated by reads, so this improvement is nothing to sneeze at.
As a final validation, we ran the PGO-optimized binary on the TPC-C benchmark which we didn’t train on, and it saw significant performance improvements as well: 5.3% reduced latency and 7.8% increased transaction throughput.
| Benchmark | Before PGO | With PGO | % Improvement |
|---|---|---|---|
| tpcc-scale-factor-1 latency | 164.45 | 155.8 | 5.26% |
| tpcc-scale-factor-1 tps | 23.37 | 25.19 | 7.79% |
TPC-C is designed as an industry-standard benchmark for “real-world” database workloads, so the fact that it saw significant improvements from PGO is good evidence that the gains are “real” as opposed to overfitted to the training data.
Changes in Go 1.22#
As we recently announced, the Go team made some improvements to the PGO process for the upcoming 1.22 release. For the sake of comparison, I ran the same experiment on a single benchmark with the new release candidate.
The first interesting note is that the new release added about 3MB to our binary compared to 1.21.6.
-rwxrwxr-x  1 ubuntu ubuntu 116M Jan 30 23:26 dolt-orig
-rwxrwxr-x  1 ubuntu ubuntu 117M Jan 31 00:29 dolt-prof-1
-rwxrwxr-x  1 ubuntu ubuntu 119M Jan 31 20:27 dolt-go22
-rwxrwxr-x  1 ubuntu ubuntu 120M Jan 31 20:24 dolt-go22-prof
The unoptimized binary produced by go 1.22rc1 is quite a bit bigger (119M) than the optimized one, with inlined functions, produced by PGO with 1.21.6 (117M). Presumably this is primarily due to growth in the Go runtime, which gets compiled into the binary.
Next let’s look at performance.
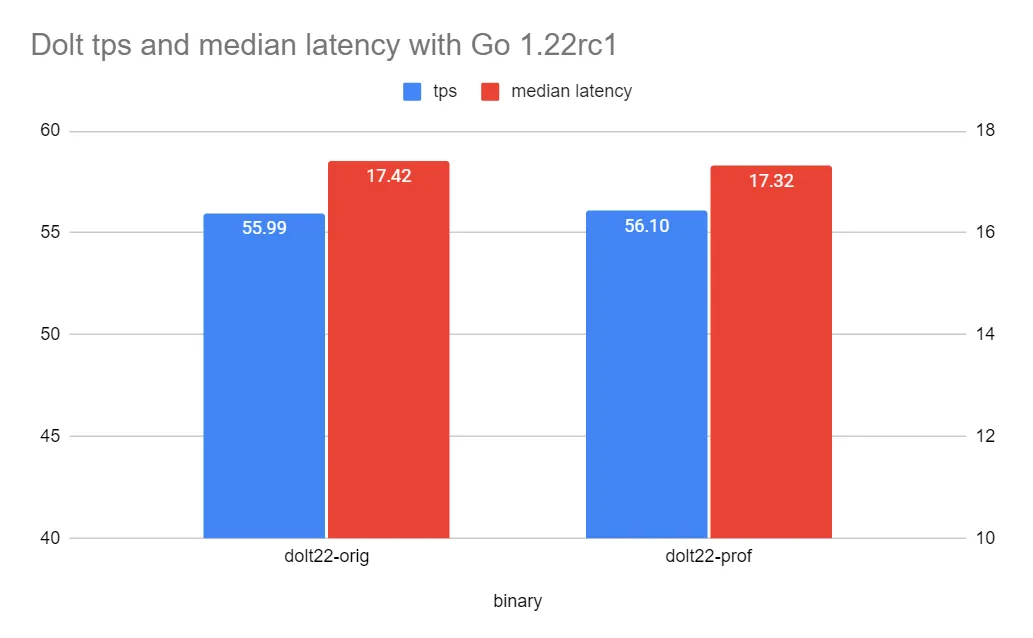
Comparing to Go 1.21.6, the default performance produced by 1.22rc1 is slightly better (55.99 tps compared to 55.59 tps). But the gains from PGO with 1.22rc1 are comparatively smaller, one might even say very marginal, well within expected measurement error. The reason for this apparent regression is not immediately clear and will require further investigation.
Next steps#
These results are compelling enough that we’re discussing how to incorporate automated PGO into our build and release process. There are a few considerations we need to nail down:
- Can we get better profiler samples than benchmarks? We could get periodic real-world samples from our production customers in our hosted offering instead. We could also sample from the hosted Dolt instance that powers DoltHub.
- How do we manage the profile artifacts? The PGO docs recommend checking them into source control, but this seems like very Google-centric advice: ours is an 800K binary file that will change relatively frequently, which would very rapidly inflate the size of our repository. To us this suggests S3 as a better archiving option, either through git LFS or some other mechanism.
- How often should we update the profile? Is it better to do on every release? If so, should we always begin with an unoptimized binary to collect profile information, or is profiling the previously-optimized binary good enough? We need to run some experiments to see.
Other tantalizing future work includes producing custom builds for each individual hosted customer suited to their particular workloads. But more experimentation would be necessary to determine if that strategy produces better results or not.
Conclusion#
Dolt is free and open source, so go check it out! Performance is an ever-present and evolving concern for us, and PGO is an attractive option that seems pretty close to “found money.” We started this experiment simply curious about what PGO was capable of, but based on the results we decided it would be silly not to incorporate into our release process. 5% faster reads with no code changes is a great deal, we’ll take it.
Have questions about Dolt or PGO? Join us on Discord to talk to our engineering team and meet other Dolt users.