
Hospital price data is pretty damn tedious to collect. There thousands of different formats for these files, which by and large contain the same kind of data, just phrased differently. That makes it expensive to buy and time consuming to make.
Our team of of contributors (bounty hunters) has been working with surgical precision to get this done. It wasn’t easy. People who know a lot about databases often don’t know about medical billing, and vice versa. So we had a lot of crosstalk between the two.
Yesterday we hit a milestone of having collected prices for 400 hospitals (for reference, there are around 5,000 hospitals in the US.) More are being added daily. I’m behind on pull requests for data, which I guess is a good thing.
The workflow goes something like this:
- each contributor works on their own database clone
- they create a branch of with their new changes
- they make a pull request against
main
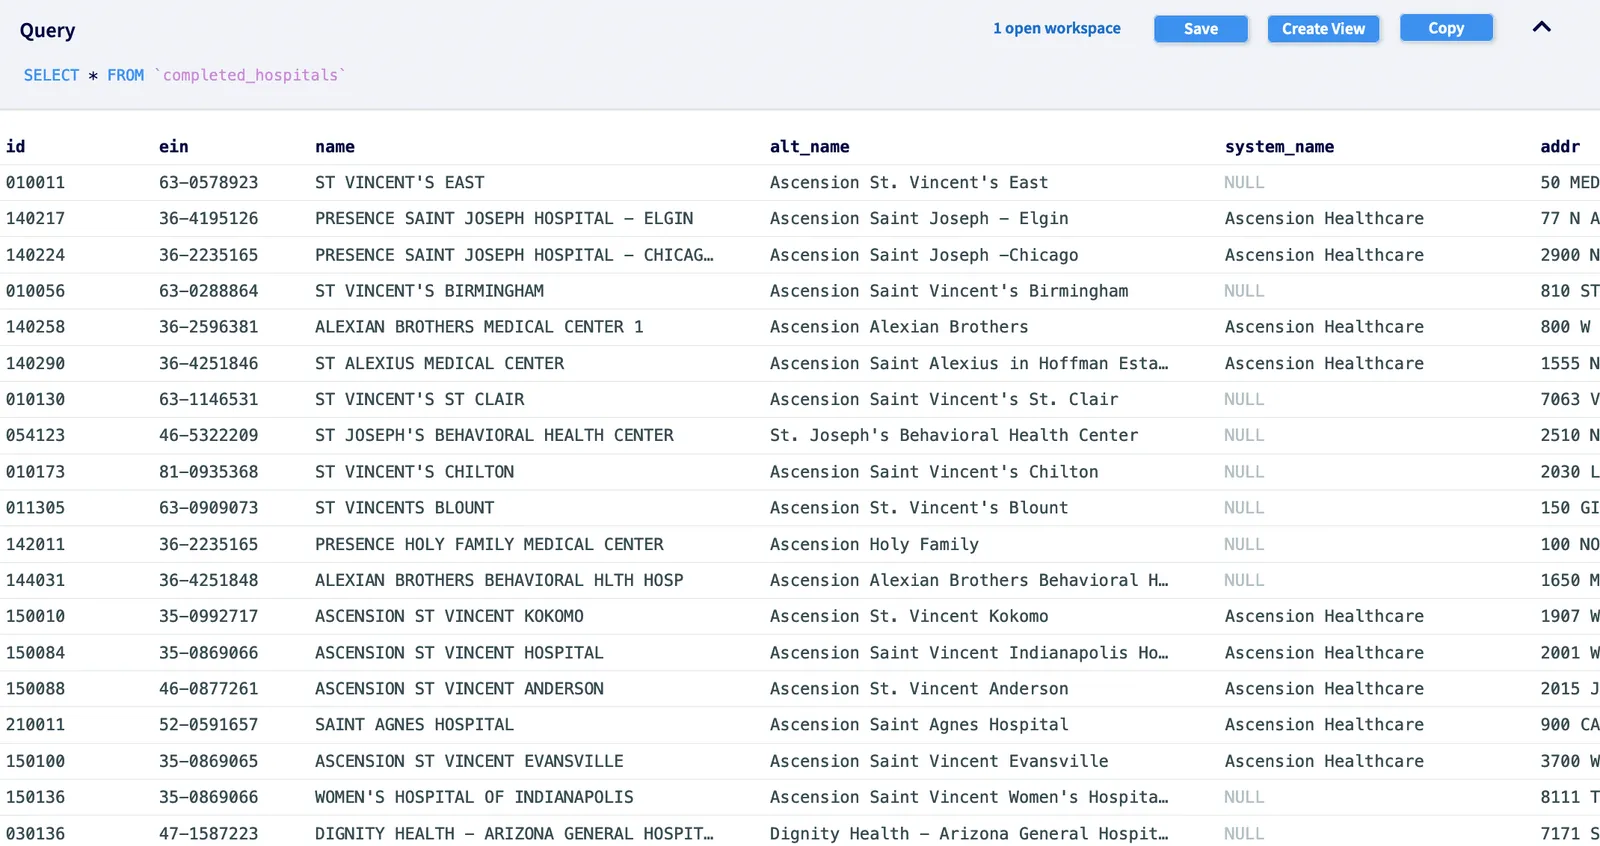
You can see a list of those changes here. DoltHub works basically like GitHub, but the codebases are databases.
Over the last few months of planning, we’ve looked at thousands of hospital MRFs (“machine readable files”). Making since of them, with their different schemas and language, has been its own little OR-sized hell. But as tends to happen in open-source projects, anonymous (and sometimes nonymous) geniuses swooped in to help out. What we have now works. And at the very least, it faithfully represents what the hospitals are publishing, while being queryable.
The database is free to use for anyone and, to our knowledge only partly investigated. The data is clean and novel enough (*with limitations, see below) that, with a little patience, you might find something new. (Drop me a line at alec@dolthub.com if you do.)
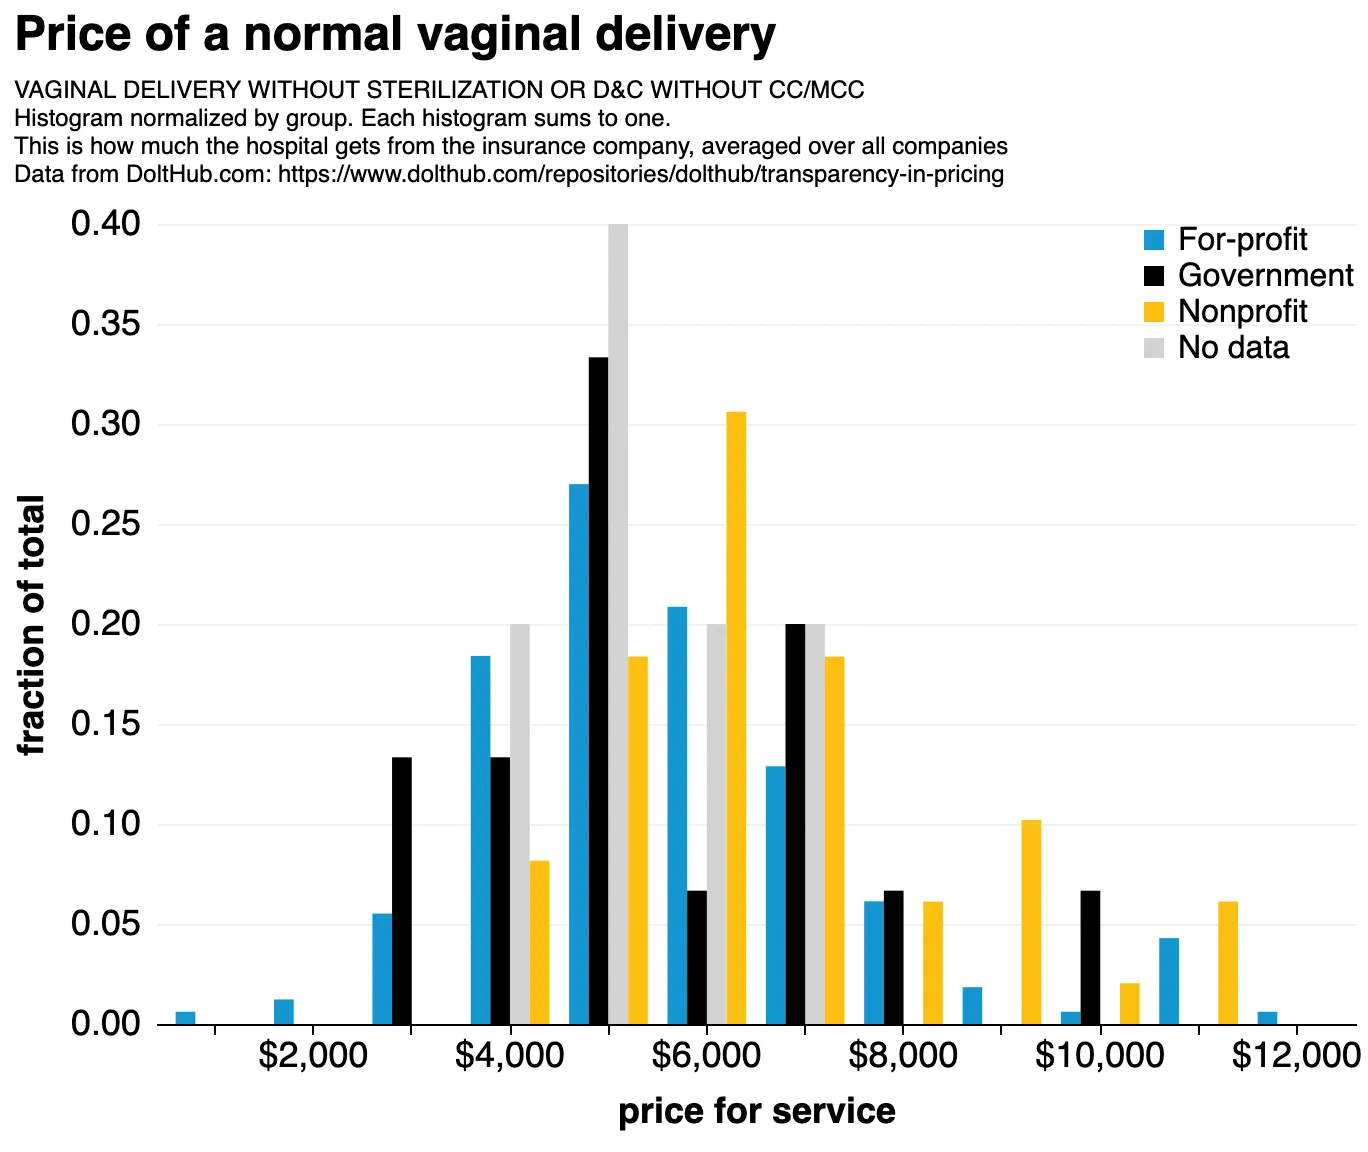 Our data. Price of a vaginal delivery, side-by-side histogram binned over 400 hospitals, colored by hospital type. Note that vaginal deliveries only sometimes include the cost of the child, which is responsible for some of the spread.
So what’s the use#
We plan to use this database in a few ways:
- finding trends in hospital pricing
- for cross-checking the transparency in coverage data
- to identify weaknesses in the existing law and make it better
Including cross-checks#
I’ve mentioned how it’s hard to know exactly transform the files. But it’s even harder to check that our contributors didn’t make mistakes in the process in the ETL process (see the examples in our repo, like the notebook for HCA Hospitals, to see how involved this can be.) Unlike code, data still compiles even if you screw it up. So we needed cross checks.
The trick was to make room for both the original and transformed data so we could see them side by side. Here’s how we do that for billing codes:
| code | hcpcs_cpt | modifiers | apc | ms_drg |
|---|---|---|---|---|
| HCPCS 14000-90, 14000TC | 14000 | 90|TC | ||
| CPT C1713 | C1713 | |||
| MSDRG 1 | 001 |
With payers, rather than transform them going in, we tag them by their type:
| payer_category | payer_name |
|---|---|
| max | DE-IDENTIFIED MAXIMUM |
| payer | BCBS PREFERRED |
| payer | Aetna [10112] |
| gross | Gross Charge |
| cash | DISCOUNTED CASH/UNINSURED |
Another example of how we keep our database faithful to the hospital representation is by adding a “thru” column for codes that are given as ranges.
| code | … | ms_drg | thru |
|---|---|---|---|
| MSDRG 31.00 | … | 031 | |
| MS-DRG V31 231-232 | … | 231 | 232 |
Believe it or not it took us a long time to think of this. (Simple interpolation doesn’t work since billing codes aren’t always contiguous, and hospitals don’t offer all procedures.)
Lots of minor changes have made our schema robust enough to accommodate nearly all hospitals.
Finally, we’ve added lots of extra hospital metadata to our hospital table make it easy to match MRFs to their hospitals. Believe it or not, all this matching of MRF to hospital has to be done heuristically and by hand! There’s not really a complete and official TaxID/hospitalID linking table.
Peering into the bowels#
I peeked at the data myself (you can copy the work in my notebook if you want.) Here are some things I found.
Lung transplants had the largest coefficient of variance over all procedures, which meant that hospitals could make relatively less or more, depending on… something. I don’t really know. Nonprofits seem to be overrepresented on the expensive end:
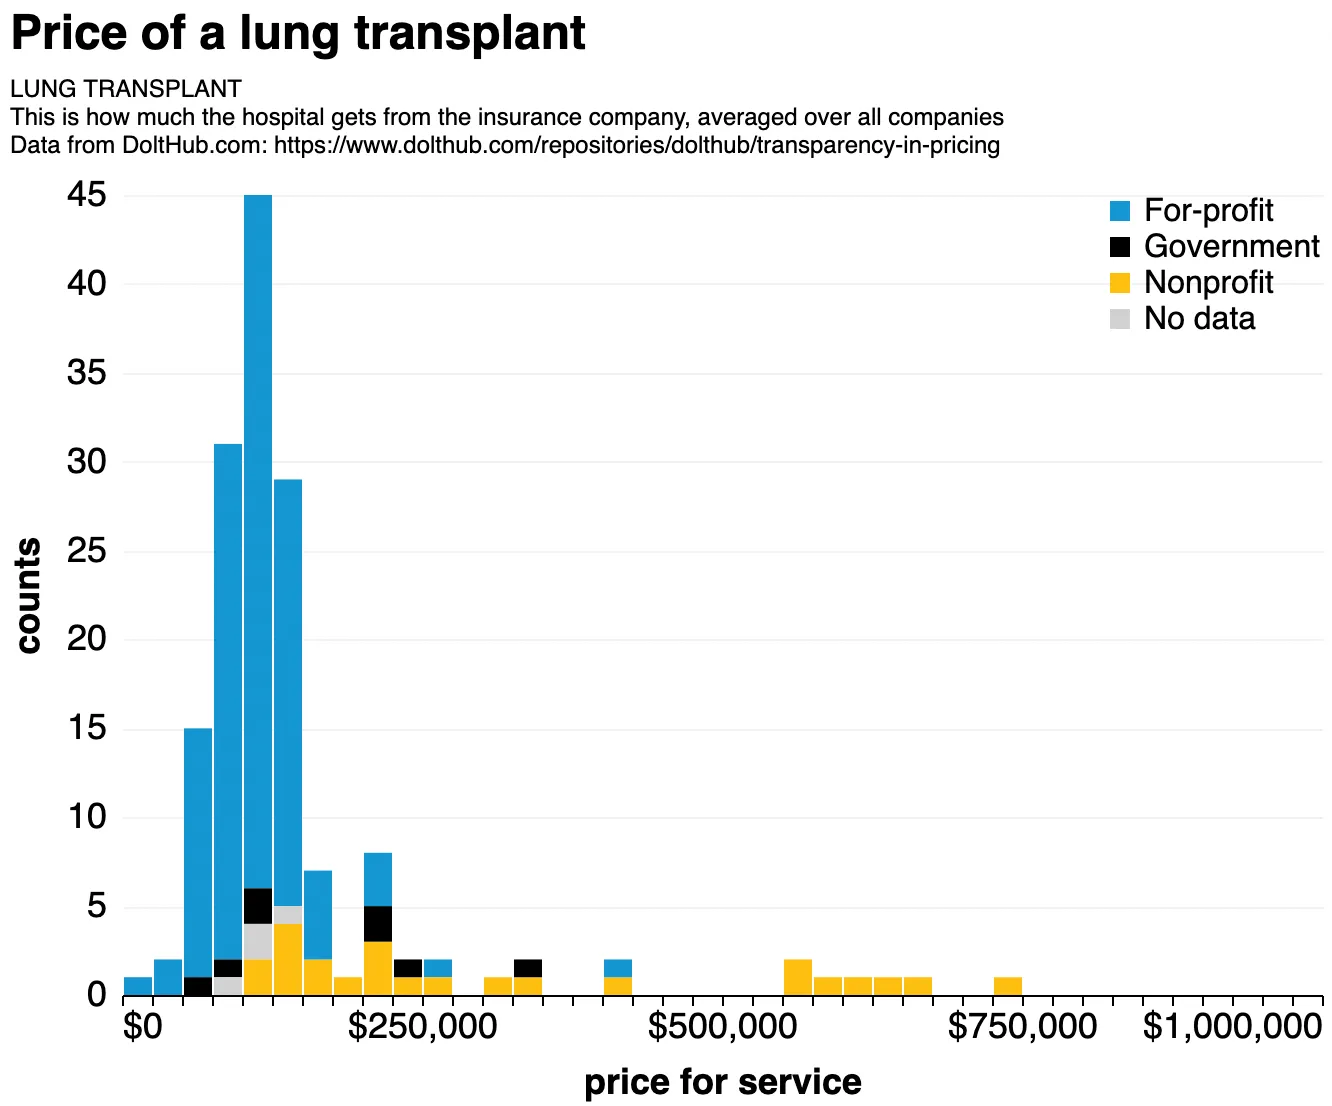 Our data. Price of a lung transplant, stacked histogram binned over 400 hospitals, colored by hospital type. I was told that non-profit hospitals almost always perform lung transplants.
We find that rural hospitals consistently offer better rates than urban ones:
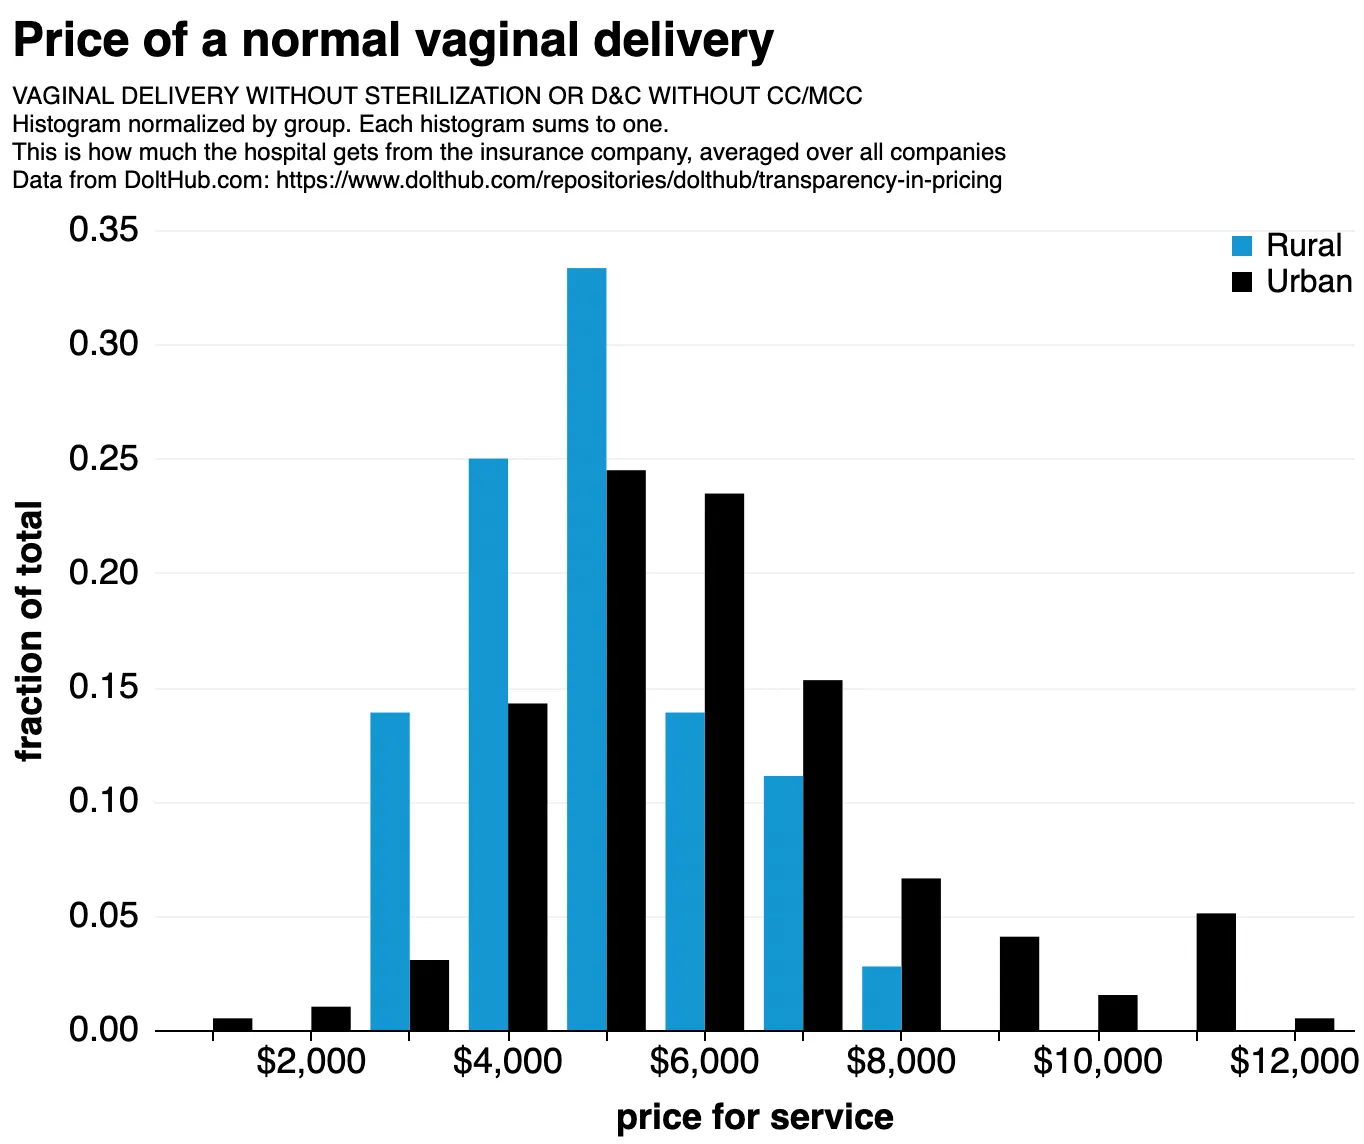 Our data. A common trend is that rural hospitals are cheaper than urban ones.
We also find that, although nonprofit and for-profit hospitals offer pretty much the same rates, there are some classes of procedures for which non-profits seem to charge higher rates. This is something I don’t understand:
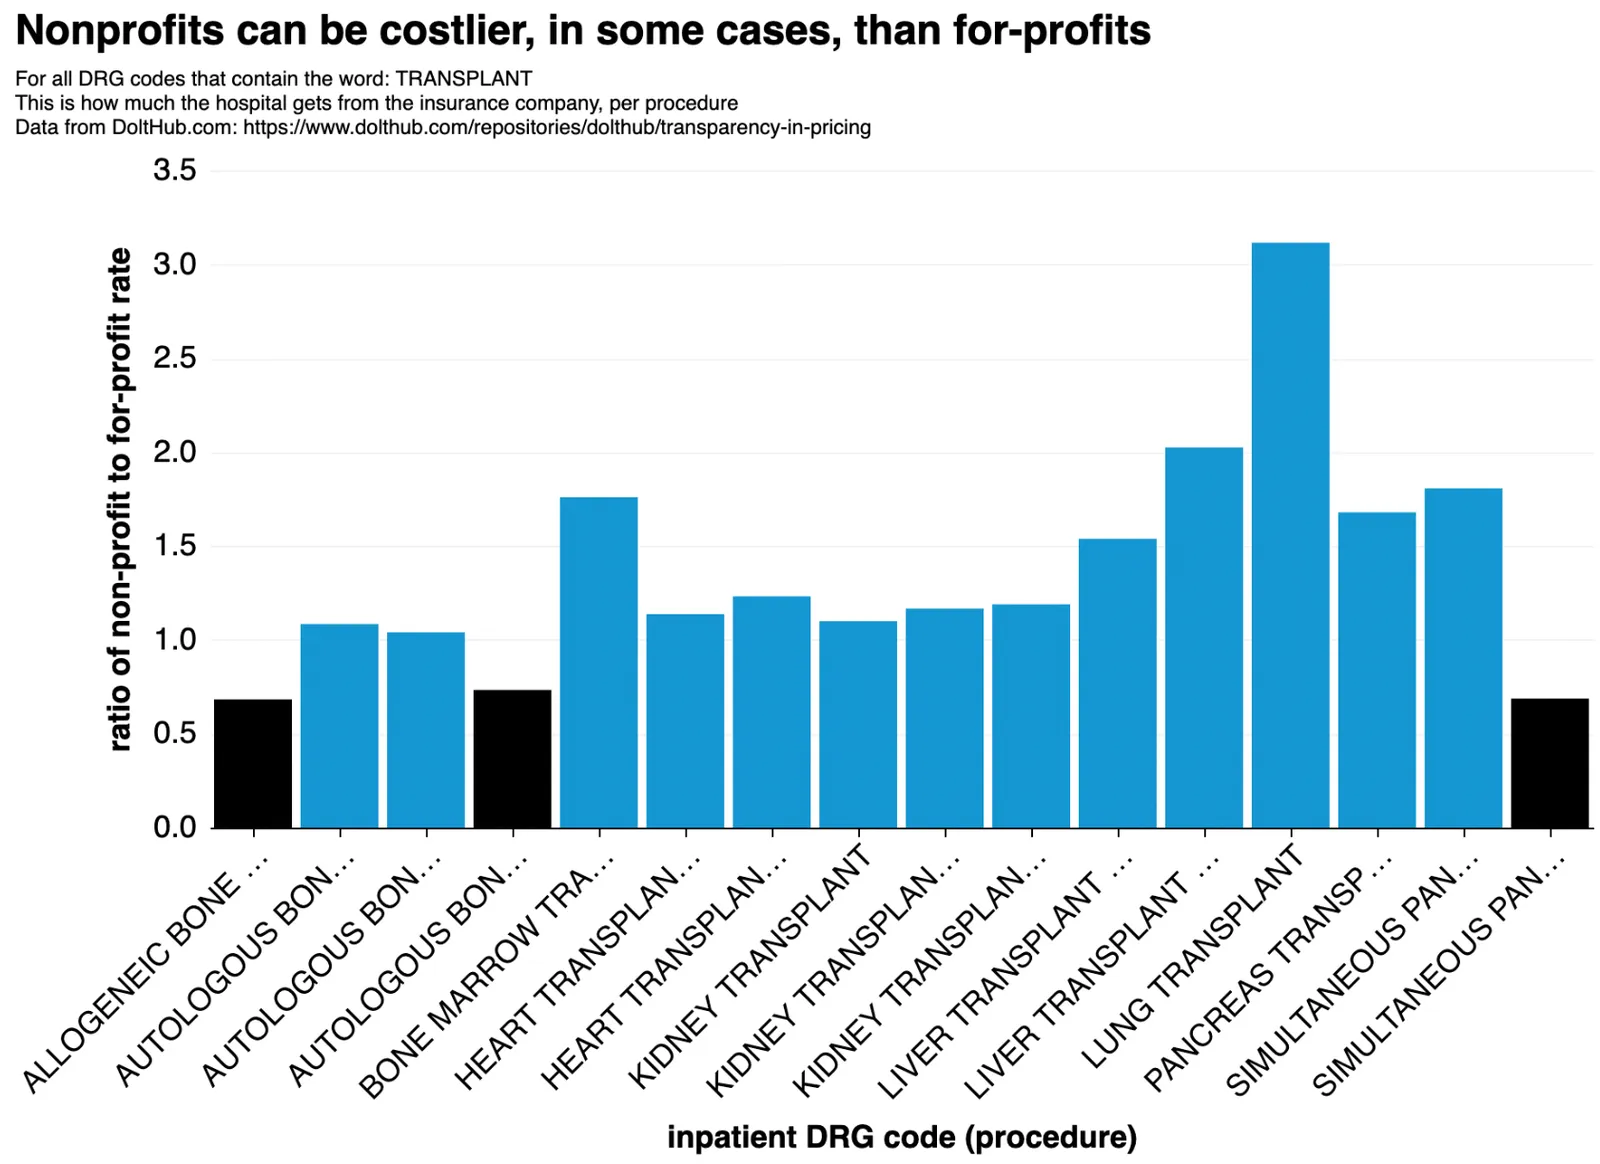 Our data. An unusual finding is that in some cases, insurance companies pay non-profits far more than for-profit hospitals for the same stuff.
This is something we kind of already know. Just because non-profits have charity obligations doesn’t mean they can’t also be expensive! In fact, they usually are. The money just gets reinvested back into the hospitals, perhaps in the form of cooler gadgets.
Limitations#
Figuring out which codes map to which prices is mostly a solved problem. Figuring out who pays is another story. Here’s how payers are actually listed:
| payer_name |
|---|
| U50_UHC_COMMERCIAL_U50_2169 |
| T33_HUMANA_CLAIMS_1186 |
| NovaSys Commercial |
| EmblemHealth Silver CSR 3 (Individual On/Off Exchange) |
| Ector County |
| i10101003_AETNA_BETTER_HEALTH_MEDICARE_830 |
| i930_AETNA_MEDICARE_ADVANTAGE_3022 |
We can do some limited string matching (.str.contains('aetna')) but we need a more robust way of translating these strings. This may be a good job for machine learning. If you think you can help out, let me know.
Last words#
I don’t think this public health data is something that anyone should have to pay for, which is mainly why I’m doing this.
Once collected, our next step is to compare the hospital data to the zillions (billions to trillions) of rates the insurance companies published. It’s the only cross-check we have against insurance companies making stuff up. To this end, we’ve made sure to link hospitals to their tax IDs so that that future work is easier (insurance data is grouped by tax ID).
If you’ve played with it, have ideas/comments/improvements, or want to just chat, jump on our Discord (https://discord.gg/tTwYVraPDM) and ask for @spacelove or send me an email at alec@dolthub.com. I’d love to hear what you have to say.
Thanks to David Gaines at Care Ignition for helpful comments while writing this article.