
Dolt is the first SQL database with Git versioning. We are drop-in MySQL compatible, support every Git command, and are actively defining a new frontier at the intersection of the two APIs.
Last month we wrote an import tutorial with initial performance benchmarks. We noted that most of our imports are fast. Faster than our sysbench average, even. But Dolt blob imports were 20x slower than MySQL. Even our sysbench script that writes a single blob is only 3 times slower than MySQL.
This blog focuses on this disconnect in blob import performance. We illustrate how we diagnosed and fixed a performance bottleneck writing blob trees. Along the way we share practical memory management patterns in Golang that we encountered during this work.
Import Batch Size#
We have several tools at our disposal to gather more information on what’s hurting blob import performance.
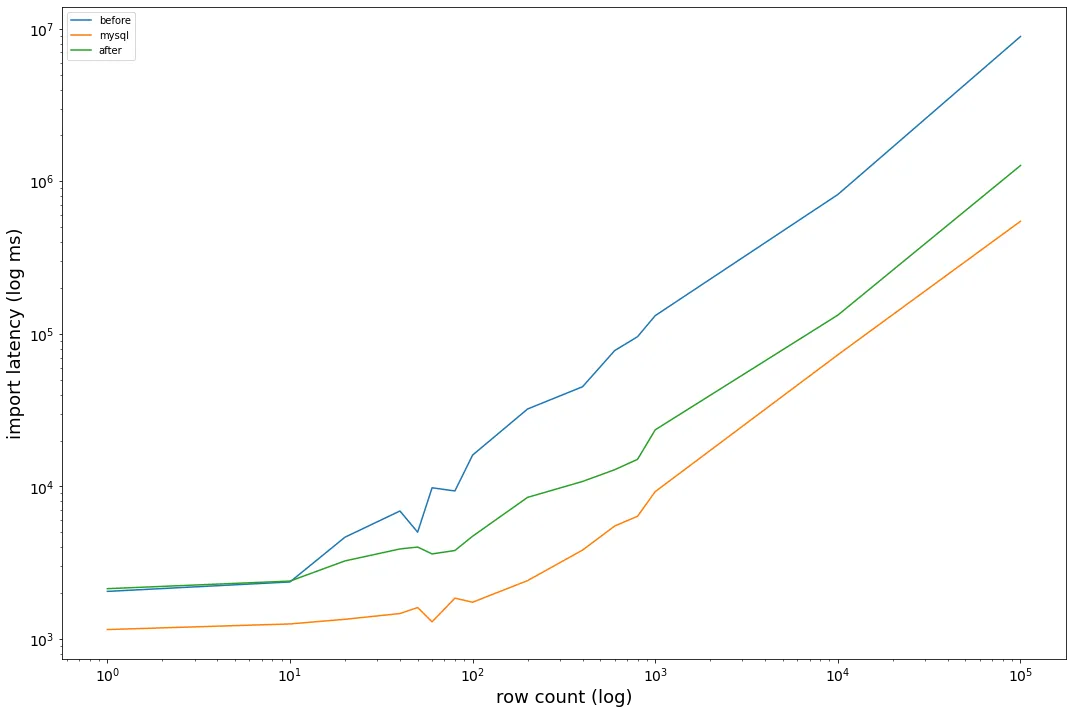
First, we can test more data points for import between 1 and 10000 rows. Below is the comparison graph sampling more row counts in the [1,10000] range. The x axis is a log of row count, and the y-axis is a log of the import latency:
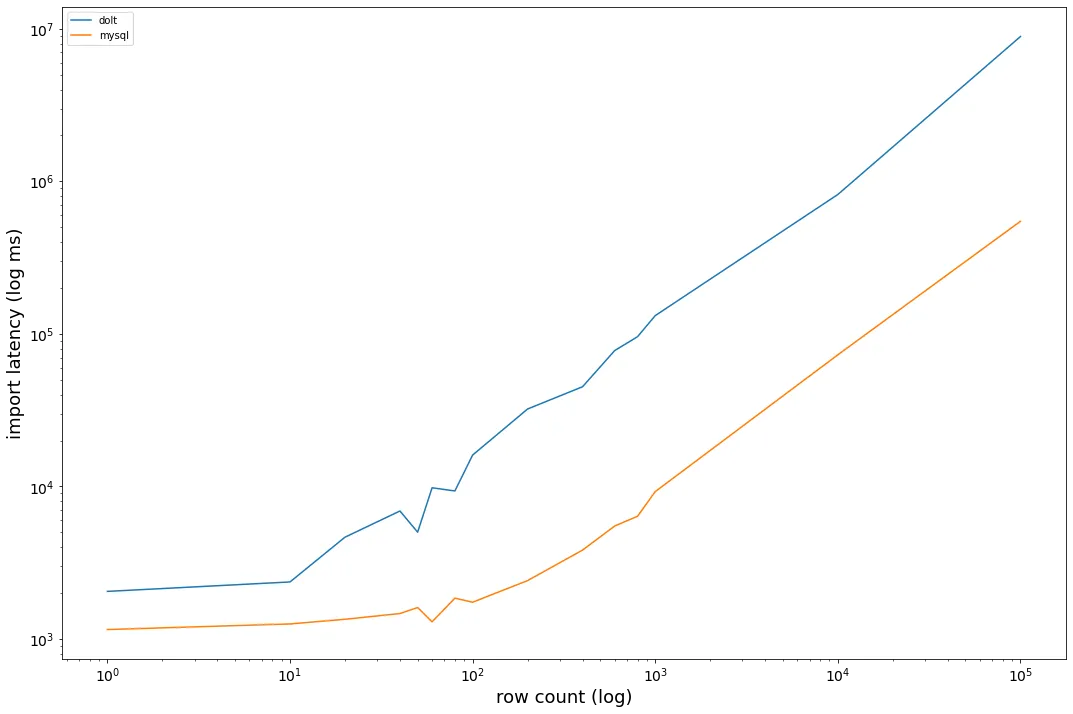
The graphs are parallel at the tail, which I think make sense. Importing n rows is an O(n) operation; importing 2*n rows should be twice as slow as n rows. Dolt hits the acceleration velocity at a fairly early row count, which introduces a gap between the two curves and points to the 20x import benchmark multiple. Something happens on repeated blob writes that slows the whole process.
CPU Profiling#
If we run a profile on the import job, we see something that looks like this:
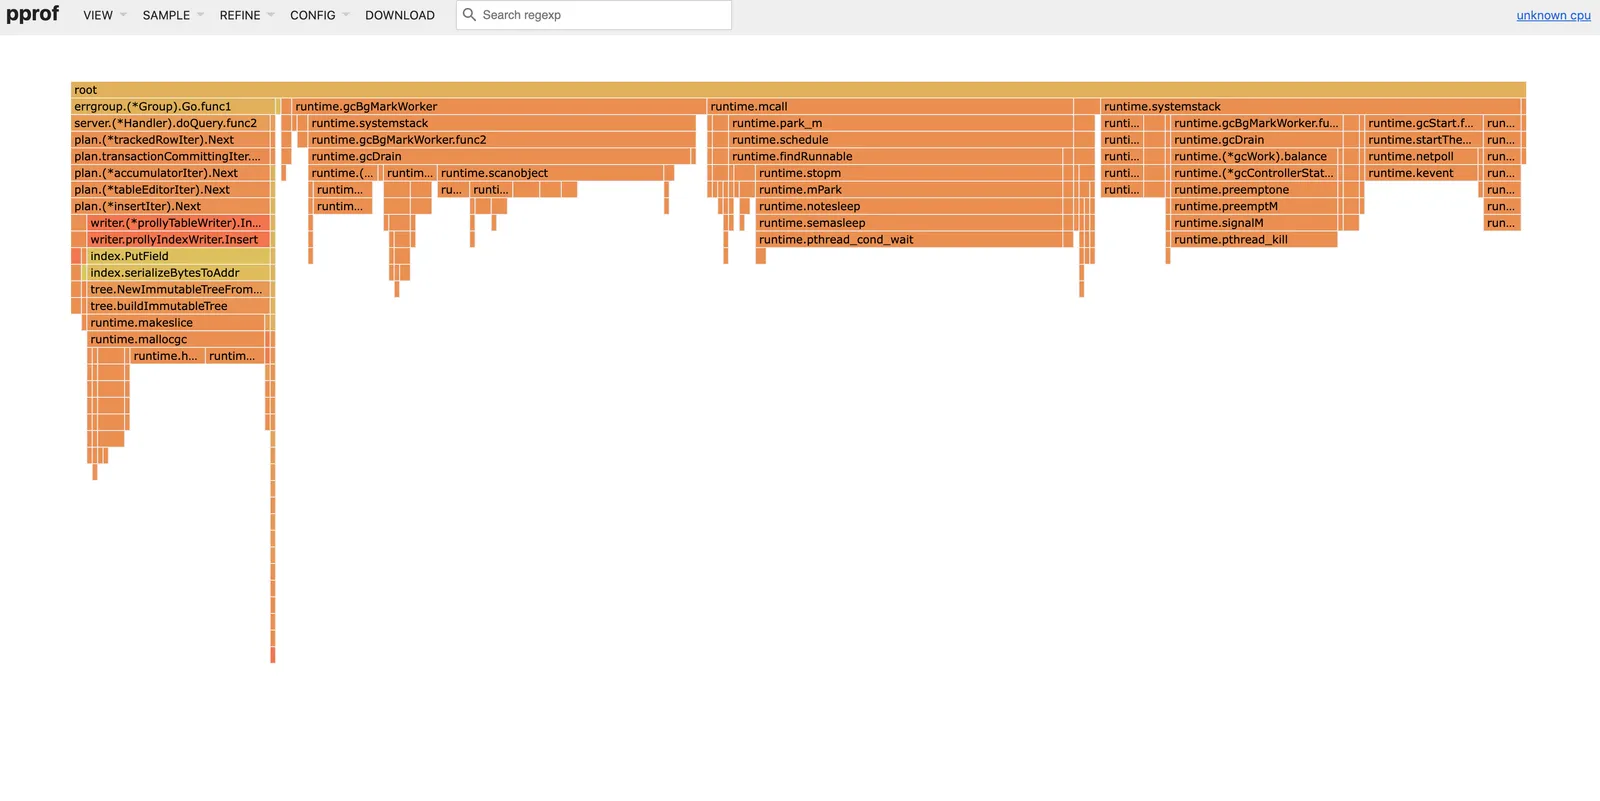
Dolt spends 14% of the time running the import, 25% of time coordinating threads, and 61% of the time performing garbage collection.
As a refresher, applications divide objects between the stack and heap. Stack objects are created and destroyed all in the span of a single function call. Heap object lifetimes are not measured in function calls. Heap objects are pooled, and when the heap is full a garbage collector sweeps unused objects to clear space for new objects. In languages like C or Rust, it is the developer’s duty to manually allocate and free pockets of memory. Golang’s automatic GC hides this work in the background.
Blob writing generates so much memory turnover that we spend more time sweeping and clearing objects than doing useful work.
Memory Benchmarking#
The previous tests suggest we are sloppily allocating objects while writing blobs. So let’s be precise, how many allocations do we make for blobs of increasing sizes?
BenchmarkBlobBuilder
BenchmarkBlobBuilder/datasize:_3
BenchmarkBlobBuilder/datasize:_3-12       15231	     75445 ns/op	  460464 B/op	      17 allocs/op
BenchmarkBlobBuilder/datasize:_4
BenchmarkBlobBuilder/datasize:_4-12       6844	    171266 ns/op	  923121 B/op	      50 allocs/op
BenchmarkBlobBuilder/datasize:_5
BenchmarkBlobBuilder/datasize:_5-12       1875	    549793 ns/op	 1040770 B/op	     270 allocs/op
BenchmarkBlobBuilder/datasize:_6
BenchmarkBlobBuilder/datasize:_6-12       273	   4389403 ns/op	 2668899 B/op	    2543 allocs/op
The tests starts with 1000 bytes (datasize: [10^]3), and increase by 10^1 through 10^6. The second column counts the number of operations run (more is better), the runtime per operation (lower is better), the memory allocated per operation (lower is better), and the number of allocations per operation (lower is better). Tests with fewer than 4000 bytes have the same profile as 10^3 as a result of the chunk size.
We use 460kB to write a 1kB blob, not good!
Verifying GC Pressure#
All signs point to GC as the blob import bottleneck, but it would be nice to verify this suspicion with a positive control test. Below we detect blobs smaller than the chunk threshold, and return immediately after writing a single chunk:
	if chunkCnt == 1 {
		buf := make([]byte, dataSize)
		_, err := r.Read(buf)
		if err != nil {
			return Node{}, err
		}
		msg := S.Serialize([][]byte{{0}}, [][]byte{buf}, []uint64{1}, 0)
		node, err := NodeFromBytes(msg)
		_, err = ns.Write(ctx, node)
		if err != nil {
			return Node{}, err
		}
		return node, nil
	}
This short circuit reduces a write time by 10x; we use 2kB of memory rather than 460kB; and we make 12 rather than 17 allocations:
- BenchmarkBlobBuilder/datasize:_3-12      15231	     75445 ns/op	  460464 B/op	      17 allocs/op
+ BenchmarkBlobBuilder/datasize:_3-12      161343	      6989 ns/op	    2696 B/op	      12 allocs/op
The benchmark results look good! But this only applies to blobs less than 4000 bytes. It would be nice if blobs bigger than 4000 bytes were also efficient.
New Blob Writer#
Tree Chunking Structure#
To go deeper, we need to understand how the current approach falls short. I ported the pre-existing algorithm from a combination of the old format blob chunker and the way row chunking works. The diagram below summarizes the writer structure:
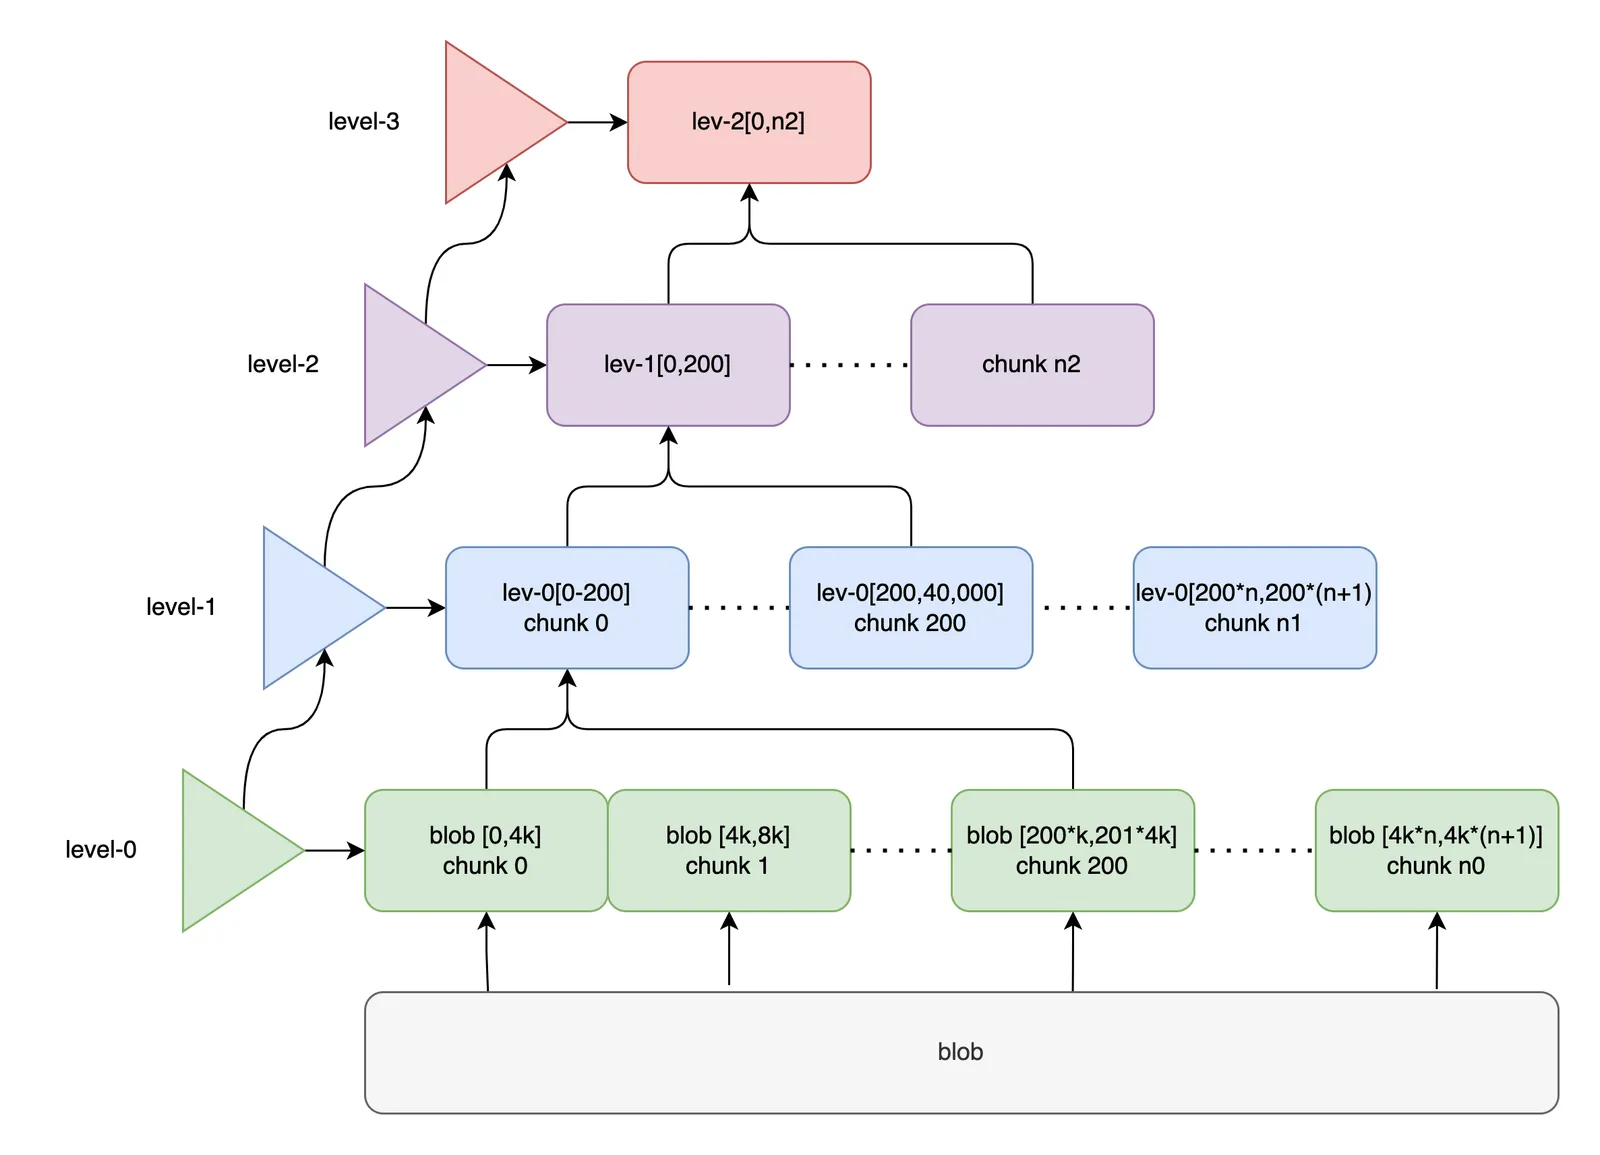
We build a tree bottom-up. The full tree writer is a linked-list of level writers, each connected to their parents. We distinguish the 0-level (leaf) from the inner tree levels. Leaves wrap the raw input. A full leaf includes 4000 blob bytes. When the 0-level leaf writer is full we return its chunked representation to an inner node parent. Non-leaf chunks are also 4000 bytes, but instead of blob data they contain 200 20-byte hash addresses to their children. The level-1 writer receives hashes of level-0 leaf nodes; the level-2 writer receives hashes of level-1 inner nodes, and so on. The tree grows as high as it needs to accommodate chunks bubbling upwards from the leaves.
This is also how our regular chunker works. The main difference is that level-0 of a row chunker contains key-value pairs; a prolly trees data nodes have sorted rows and reference first and last key like normal B-trees.
Memory Reduce and Reuse#
A chunker writing regular rows cannot predict how deep the tree will be. This lends itself to dynamically extending the tree height at runtime. The same strategy for blobs produces many small allocations and often over-allocates unfilled levels.
But blobs have a fixed number of bytes, we know how many nodes will be written, and we know how tall the result tree will be. Instead, we can allocate one buffer ahead of time for all levels:
	// Allocate everything we need in batch, slice them up down below.
	buf := make([]byte, b.topLevel*numAddrs*hash.ByteLen)
	writers := make([]blobLevelWriter, b.topLevel)

	for i, addrs := 0, 0; i < b.topLevel; i, addrs = i+1, addrs+numAddrs {
		wr := &writers[i]
		wr.bb = b
		wr.child = b.wr
		wr.buf = buf[addrs*hash.ByteLen : (addrs+numAddrs)*hash.ByteLen]
		wr.level = i + 1
		wr.sz = numAddrs
		b.wr = wr
	}
One soft observation is that blobs in the same workflow often share similar tree heights. In practice this limits new allocations to 200x blob increases (1 MB -> 2 GB). We can reuse buffers for equi-level or smaller blobs:
...
	// Allocate everything we need in batch, slice them up down below.
	if b.levelCap < b.topLevel {
		b.expand(numAddrs)
		b.levelCap = b.topLevel
	}
...

func (b *BlobBuilder) expand(numAddrs int) {
	b.buf = make([]byte, b.topLevel*numAddrs*hash.ByteLen)
}
The last change we made is reusing node placeholders that are unused writing blobs, but were still contributing allocations:
var zeroKey = []byte{0}Results#
Smaller and less frequent allocations means fewer GC sweeps for blob writes of all sizes:
-- after
BenchmarkBlobBuilder/datasize:_3
BenchmarkBlobBuilder/datasize:_3-12       234128	  5673 ns/op	    2608 B/op	       8 allocs/op
BenchmarkBlobBuilder/datasize:_4
BenchmarkBlobBuilder/datasize:_4-12       26074	     41468 ns/op	   17560 B/op	      24 allocs/op
BenchmarkBlobBuilder/datasize:_5
BenchmarkBlobBuilder/datasize:_5-12       2737	    378950 ns/op	  133004 B/op	     134 allocs/op
BenchmarkBlobBuilder/datasize:_6
BenchmarkBlobBuilder/datasize:_6-12       282	   3974650 ns/op	 1288281 B/op	    1269 allocs/op

-- before
BenchmarkBlobBuilder
BenchmarkBlobBuilder/datasize:_3
BenchmarkBlobBuilder/datasize:_3-12       15231	     75445 ns/op	  460464 B/op	      17 allocs/op
BenchmarkBlobBuilder/datasize:_4
BenchmarkBlobBuilder/datasize:_4-12       6844	    171266 ns/op	  923121 B/op	      50 allocs/op
BenchmarkBlobBuilder/datasize:_5
BenchmarkBlobBuilder/datasize:_5-12       1875	    549793 ns/op	 1040770 B/op	     270 allocs/op
BenchmarkBlobBuilder/datasize:_6
BenchmarkBlobBuilder/datasize:_6-12       273	   4389403 ns/op	 2668899 B/op	    2543 allocs/op
The difference is most pronounced on small blobs, as we saw in the earlier section. 6 megabyte files have a similar runtime, but with half as many allocations. Because bigger files spend a greater proportion of time performing IO on disk, the GC impact for big writes is a smaller.
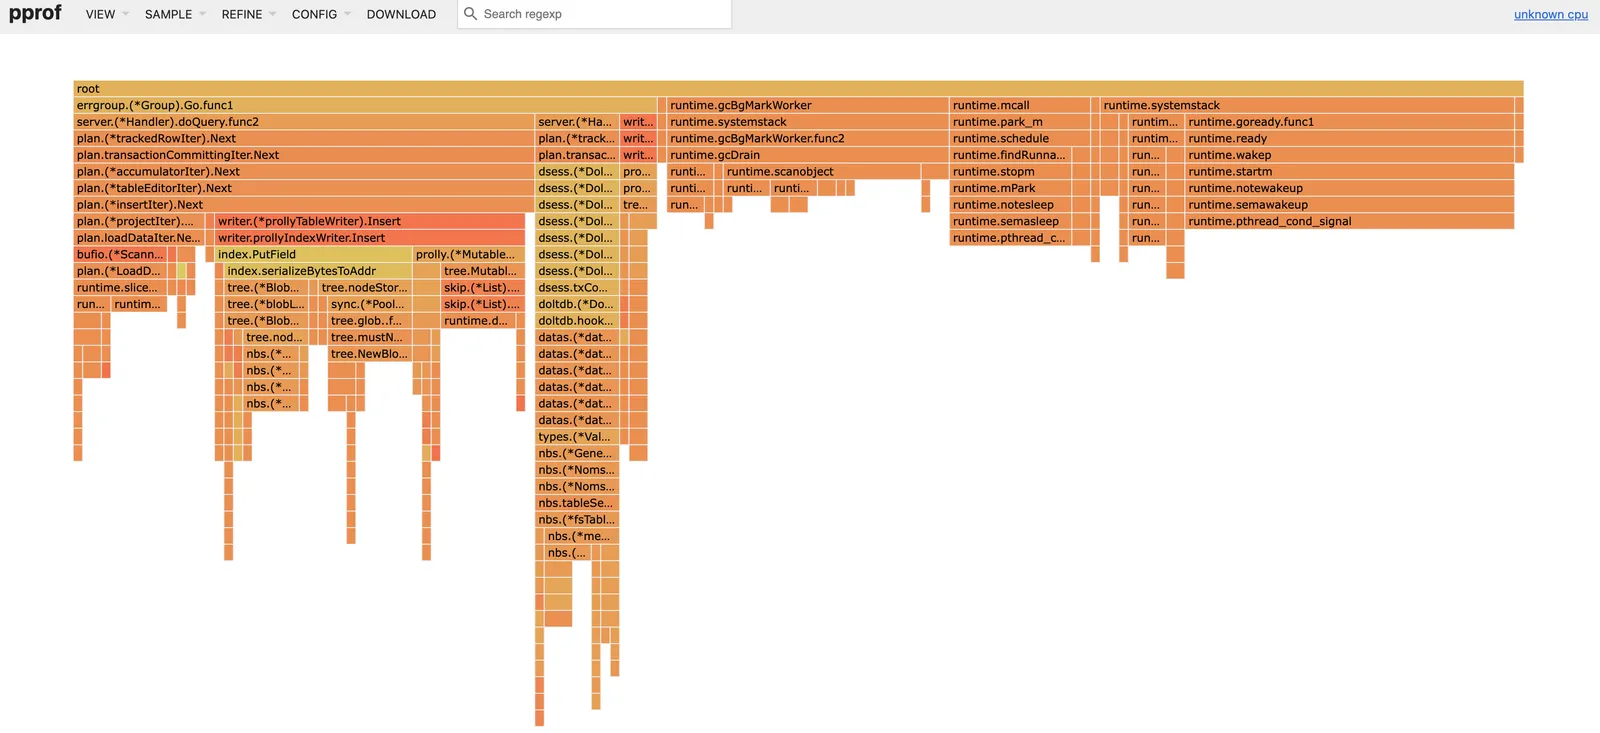
Rewinding back to the CPU profile, we now see 20% of the time spent in GC, compared to 60% before:
Finally we reconsider the import benchmarks that initiated this work:
| detail | row_cnt | time |
|---|---|---|
| no blob | 200000 | 1.25 |
| before 1 blob | 200000 | 18.43 |
| before 2 blobs | 200000 | 61.77 |
| after 1 blob | 200000 | 2.23 |
| after 2 blobs | 200000 | 2.64 |
Not using blobs is still fastest (you should use VARCHAR not TEXT!), but we
are much happier with the 10x in performance.
Future#
We addressed the immediate bottleneck affecting users, but there are a variety of untapped optimizations. For example, leaf buffers may be good candidates for reuse. We also allocate one buffer per level, but technically we only need two buffers to build the tree: the current level being written, and its input source.
In our rush to fix the bottleneck and move to new customer bugs, we undoubtedly missed other edge cases! If you can find a version that streamlines the 8 allocs/op to an even lower number, feel free to contribute a pull request to Dolt!
Summary#
Blob writes have been a drag on performance for awhile. It feels satisfying shoring up another performance bottleneck negatively impacting Dolt’s first hour experience. Along the way we learned more about Golang’s memory management, and some common patterns for better cooperating with the garbage collector. We hope to follow up with more general improvements to Dolt’s memory management in the future, hopefully with equally impressive performance results!
If you have any questions about Dolt, databases, or Golang performance reach out to us on Twitter, Discord, and GitHub!