
Dolt DB is the world’s first SQL database that you can branch and merge, push and pull, fork and clone just like a git repository.
We built Dolt’s storage engine from the ground up to make these operations fast. Writing a row storage engine and a SQL execution engine isn’t easy. There’s a reason that most people don’t even attempt it, but at DoltHub we’re built different.

Today we’re going to review several case studies of performance problems we ran into while benchmarking Dolt to get row access to be as fast as MySQL. Every case study is a real performance problem we encountered and fixed.
Let’s get started.
Case study: interface assertions#
While experimenting with a faster way to spool rows off disk and get them through the execution engine, we decided to make new row iteration interface. Because we already had many implementations of the original interface lying around we thought we would just extend it, like this:
type RowIter interface {
    Next(ctx *Context) (Row, error)
}

type RowIter2 interface {
    RowIter
    Next2(ctx *Context, frame *RowFrame) error
}
The architecture of our SQL engine involves a deeply nested execution
graph, with each node in the graph getting a row from the layer below,
doing some work on it, then passing it up the chain. When we went to
implement the Next2 method in an iterator, it looked something like
this:
type iter struct {
    childIter  sql.RowIter
}

func (t iter) Next2(ctx *sql.Context, frame *sql.RowFrame) error {
    return t.childIter.(sql.RowIter2).Next2(ctx, frame)
}
But when we ran this code, we noticed in the profiler graphs that we
were paying a very substantial performance penalty because of this
pattern. In our CPU graph, we noticed a lot of time being spent on
runtime.assertI2I:
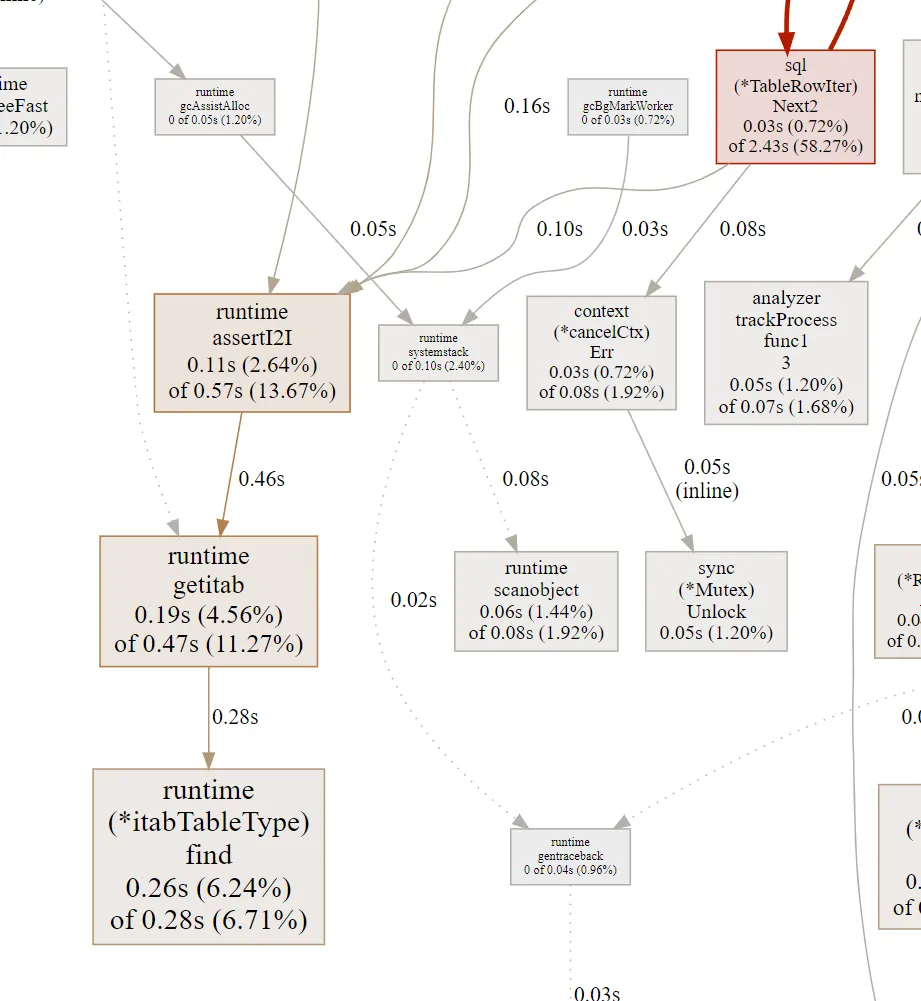
runtime.assertI2I is a method called by the go runtime to validate
that an interface’s static type can be converted to a different type
at runtime. This involves a lookup into the interface table and an
interface pointer conversion, which is not that expensive but
certainly not free either. Because of the nested execution graph, we
were doing this operation many times per row fetched, resulting in a
pretty serious performance penalty.
Solution: eliminate interface type conversions#
To get rid of the penalty, we simply eliminate the conversion by storing two fields wherever necessary, one for each static type.
type iter struct {
    childIter  sql.RowIter
    childIter2 sql.RowIter2
}
func (t iter) Next(...) {
    return t.childIter.Next(ctx)
}
func (t iter) Next2(...) {
    return t.childIter2.Next2(ctx, frame)
}
The two fields point to the same object in memory, but since they have different static types they need different fields to avoid a conversion penalty.
Case study: working with slices#
Next we’re going to look at different ways to allocate slices and their impact on performance, especially garbage collector overhead. We’ll be profiling a method that generates a slice of random elements and then sums them up. We’ll call this over and over in our profile.
func sumArray() uint64 {
    a := randArray()
    var sum uint64
    for i := range a {
        sum += uint64(a[i].(byte))
    }
    return sum
}
We’ll look at 4 different ways to implement the randArray()
function, from worst to best, and demonstrate the impact the different
implementations have on the performance of the program.
Worst: Appending to a slice#
The worse way to get this slice is to make a zero-length one, then
call append on it over and over, like this:
func randArray() []interface{} {
    var a []interface{}
    for i := 0; i < 1000; i++ {
        a = append(a, byte(rand.Int() % 255))
    }
    return a
}
It doesn’t matter whether we start with a nil slice like above, or if
we make a zero-length one with make([]interface{}, 0), the effect is
the same. When we examine the flame graph for this profile, we can see
that garbage collection is taking up a massive overhead, and that
runtime.growslice is consuming a full quarter of our CPU cycles.
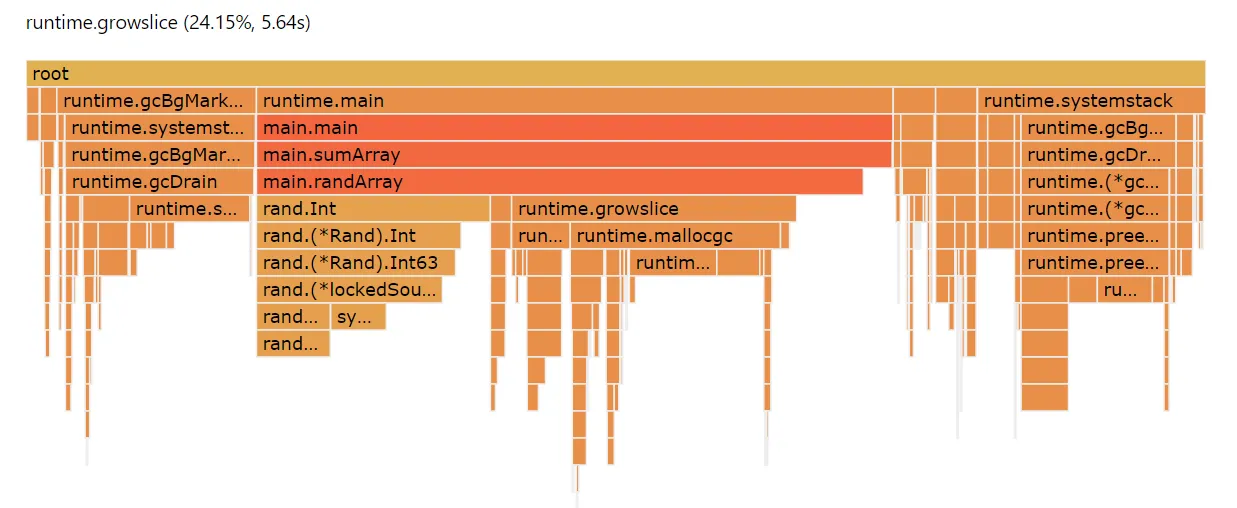
Overall, less than half our CPU cycles are going directly toward useful work.
The reason this is so expensive is that go slices have a backing
array, and when you append to them, if the backing array is out of
capacity, the runtime has to allocate a larger array, copy all the
elements, and collect the old array.
We can do a lot better than this.
Better: static array size#
We can get rid of the overhead of runtime.growslice by fixing the
size of the slice at creation time, like this.
func randArray() []interface{} {
a := make([]interface{}, 1000)
for i := 0; i < len(a); i++ {
a[i] = byte(rand.Int() % 255)
}
return a
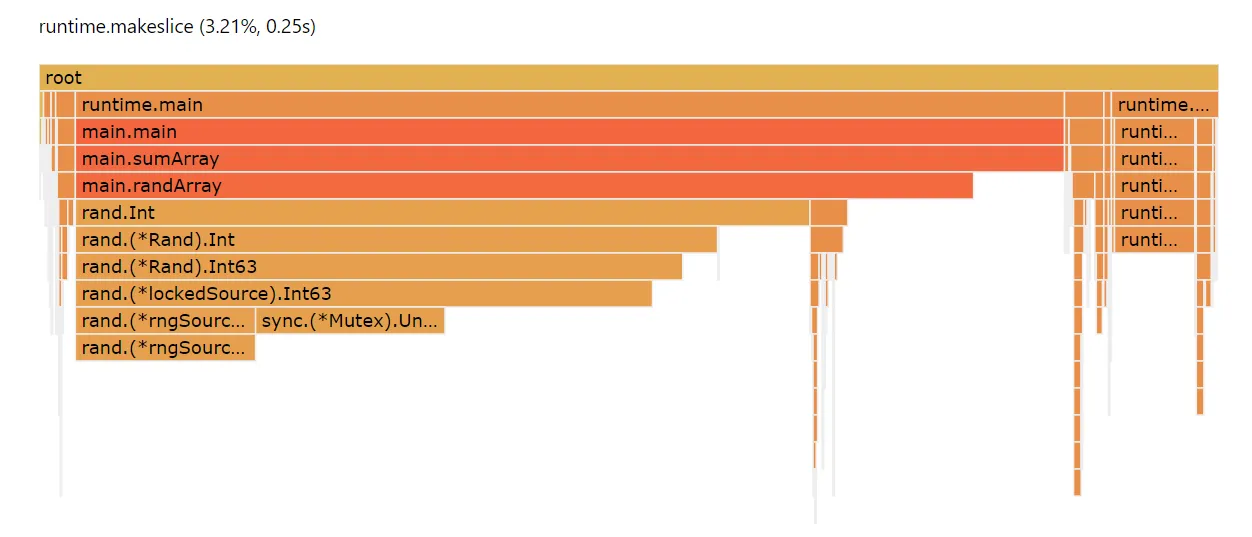
}When we profile this code, we can see that we’ve eliminated the
overhead of runtime.growslice entirely, as well as taken quite a bit
of pressure off the garbage collector.
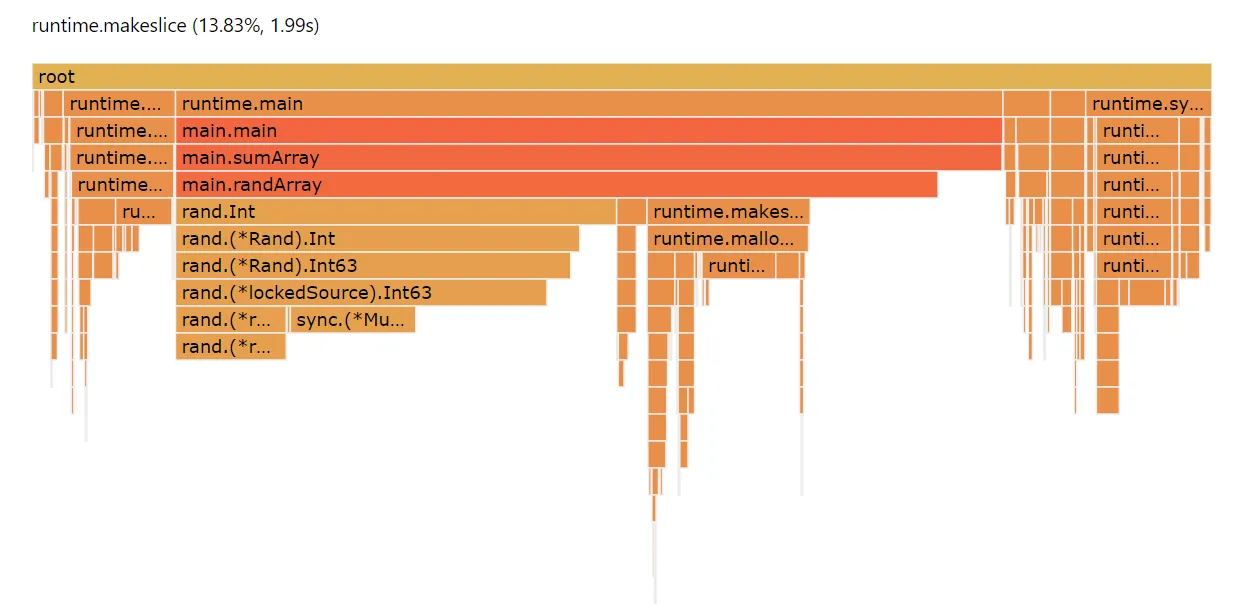
You can tell at a glance this implementation is spending a lot more
time doing useful work. But there’s still a significant performance
hit associated with creating a slice every time. A full 13% of our
runtime is just spend allocating slices, runtime.makeslice.
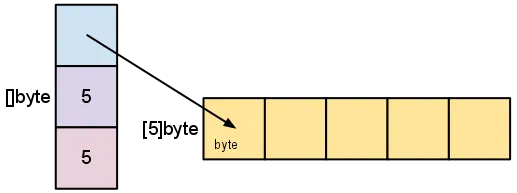
Even better: primitive slice type#
Strangely enough, we can do quite a bit better by allocating a slice
of byte instead of a slice of interface{}. The code to do this:
func randArray() []byte {
a := make([]byte, 1000)
for i := 0; i < len(a); i++ {
a[i] = byte(rand.Int() % 255)
}
return a
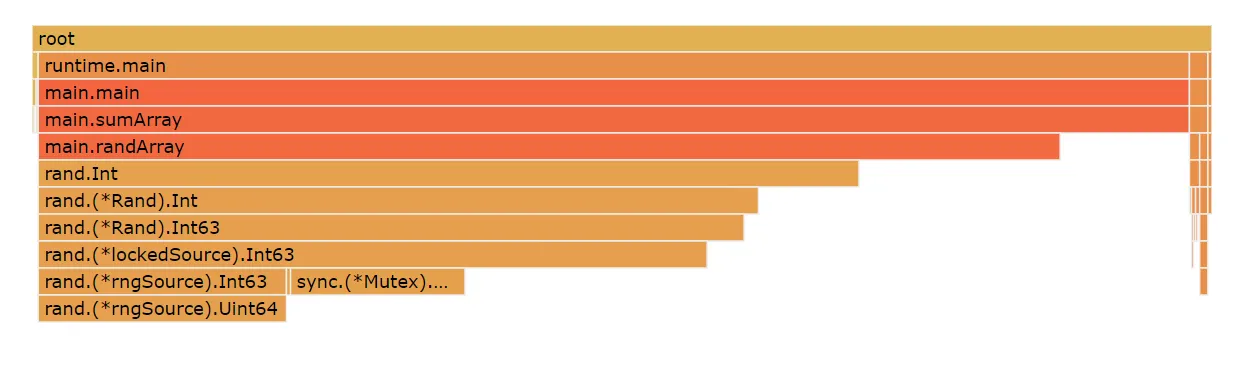
}When we look at the profile, we can see that the impact of
runtime.makeslice is down to about 3% of CPU, from over 13%. You can
barely even see it on the flame graph, and it’s also easy to see a
corresponding reduction in garbage collector overhead.
The reason for this discrepancy is just that interface{} types are
both more expensive to allocate (a pair of 8-byte pointers, instead of
a single byte), as well as more expensive for the garbage collector to
reason about and process. The moral of this story is that it often
pays off performance-wise to allocate a slice of primitives, rather
than interface types, when you can.
Best: allocate outside the loop#
But the single best way to implement this function is to not allocate any memory inside it at all. Instead, let’s allocate a slice once, in an outer scope, and pass it into this function to be filled up.
func randArray(a []interface{}) {
    for i := 0; i < len(a); i++ {
        a[i] = byte(rand.Int() % 255)
    }
}
When we do this, we eliminate all garbage collection pressure completely, and we spend effectively all our CPU cycles doing useful work.
We don’t have to pass a slice in as a parameter, we just need to avoid
allocating it every time this function is called. Another way to
achieve this is to use a global sync.pool variable to re-use slices
between invocations of the function.
Summary#
Using the time spent calling rand.Int as a proxy for how much CPU time we’re spending doing useful work, we get the following summary:
- Appending: 20%
- Static slice with interface{}: 38%
- Static slice with byte: 62%
- Slice as param: 70%
The bottom line: how you work with slices can have a really dramatic impact on the overall performance of your program.
Case study: struct v. pointer as receiver#
There’s an ongoing and very lively debate in the golang community about whether to use a struct or a pointer to a struct as the receiver type when implementing an interface. Opinions differ.


The reality is that there are tradeoffs to both approaches. Structs are typically more expensive to copy onto the stack than a pointer, especially for a large struct. But keeping objects on the stack instead of the heap avoids garbage collector pressure, which can be faster in certain circumstances. From an aesthetic / design perspective there are tradeoffs as well: sometimes it’s really desirable to enforce immutability semantics, which you get with a struct receiver.
Let’s illustrate the performance penalty you pay for a large struct. We’re going to use a really large one, 36 fields, and call a method on it over and over.
type bigStruct struct {
    v1, v2, v3, v4, v5, v6, v7, v8, v9 uint64
    f1, f2, f3, f4, f5, f6, f7, f8, f9 float64
    b1, b2, b3, b4, b5, b6, b7, b8, b9 []byte
    s1, s2, s3, s4, s5, s6, s7, s8, s9 string
}

func (b bigStruct) randFloat() float64 {
    x := rand.Float32()
    switch {
    case x < .1:
        return b.f1
        …
}
When we profile this method over and over, we can see that we’re
paying a really large penalty, 35% of CPU cycles, on something called
runtime.duffcopy.
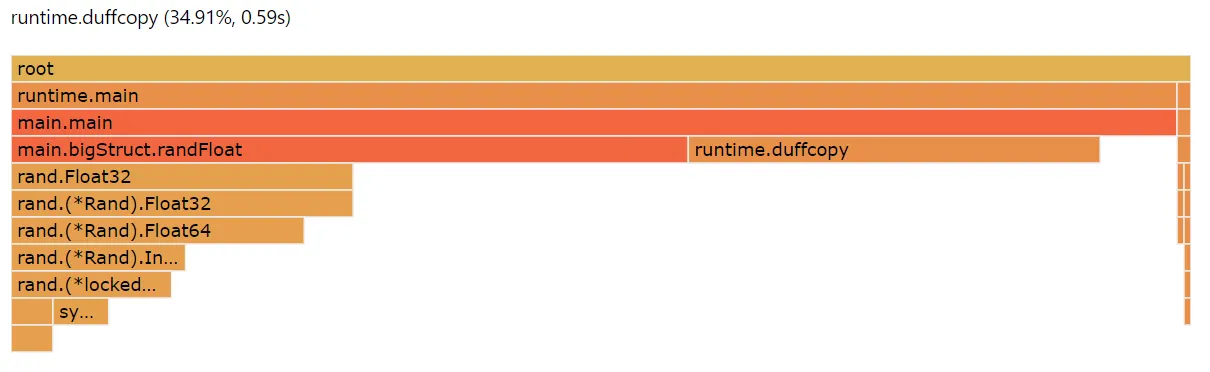
What’s runtime.duffcopy? It’s the go runtime’s way of copying large
contiguous chunks of memory around (typically structs) in certain
cases. It’s called duffcopy because it kind of resembles a Duff’s
device, which is a C compiler hack Tom Duff discovered in the 80s. He
realized that you could abuse the C compiler to implement
loop-unrolling by interleaving the constructs of a loop and switch:
register short *to, *from;
register count;
{
    register n = (count + 7) / 8;
    switch (count % 8) {
    case 0: do { *to = *from++;
    case 7:      *to = *from++;
    case 6:      *to = *from++;
    case 5:      *to = *from++;
    case 4:      *to = *from++;
    case 3:      *to = *from++;
    case 2:      *to = *from++;
    case 1:      *to = *from++;
            } while (--n > 0);
    }
}
Loop unrolling can be a huge speedup because you don’t have to check
the loop condition on every pass through the loop. Go’s duffcopy
isn’t actually a Duff’s device, but it is a loop unrolling: the
compiler emits N instructions to copy memory, rather than using a loop
to do so.
The way to avoid paying this penalty is to simply use a pointer to the struct as the receiver, avoiding the expensive memory copy operation. But be careful about generalizing this advice — your intuition about which technique performs better may be incorrect, as it really depends on a lot of factors distinct to your application. At the end of the day, you really do need to profile the alternatives to see which performs better overall, including the impact of garbage collection.
Summary#
We still have a lot of work to do to make Dolt as performant as more mature database technologies, especially when it comes to query planning. But we’ve already managed to squeeze a 2x performance boost out of the engine with these sorts of simple optimizations, as well as another 3x by rewriting our storage layer entirely. We’re now about 2.5x the latency of MySQL on simple benchmarks, and we’re not done. We’re very excited to keep making our database faster as we approach our 1.0 release.
If you’re curious about Dolt and want to learn more, come by and talk to us on Discord.