
One of the most expensive hospitals in America may actually be a nonprofit. Insurers pay the hospital, Mary Lanning Healthcare in Nebraska, an average of $200,000 for a particular neurosurgery. However, drive less than hour West to Kearney Regional Medical Center and you’ll get a real discount. There, the same surgery costs your insurance company only $37,000 — 80% less. Even stranger is that unlike MHC, Kearney Regional has been a for-profit hospital since it opened in 2011.
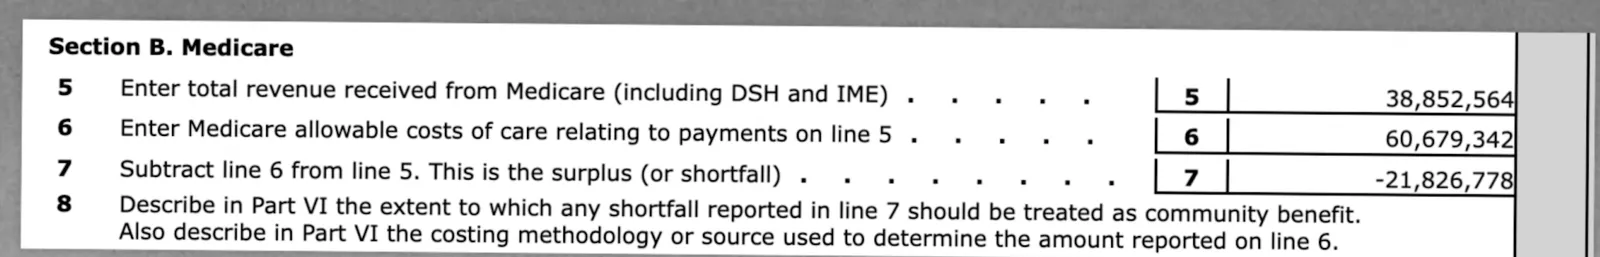
As a registered nonprofit, Mary Lanning Healthcare pays no income or property taxes despite making $200M a year in revenues. Tallied up, their community benefits sum to over $30 million dollars a year, putting them just barely in the black. But what’s the point in having sticker prices that are so high, only to give away millions in benefits? Could there be a connection?
Using data recently obtained at DoltHub through our bounty program, we analyzed over 300 million hospital prices from 1800 different hospitals. Check out the analysis below.
This is also available as Jupyter notebook on GitHub.
Aside: Our participants managed to cover 30% of the 6000 hospitals in America and collectively earned $15k for putting together the database, the largest open database of hospital prices ever. If you’re interested in that sort of thing, join a bounty and start hunting. It’s a great way to learn Dolt, python, and SQL.
The data#
Hospitals first started posting their prices after a 2019 Trump administration law forced them to (although the majority are still noncompliant.)
We crunched the numbers with a fast and ergonomic python library called pola-rs (the spiritual successor to pandas) and put the code in this blog post. pola-rs’s LazyFrame features were essential for reading the 300M-row table into memory by pre-filtering it. Visuals were done with Altair, which has a friendlier API than matplotlib. Dolt makes it easy to copy a database with branches, so I took the main branch and tidied it up slightly. We invite readers to clone that branch and run the analysis themselves.
Medical chart toppers#
Hospital price shopping can feel a lot like mattress shopping, with all the different codes and modifiers making it hard to compare like with like. We decided to look only at 70 of the most common procedures — ones which are explicitly requested by the transparency law — in order to get a good apples-to-apples comparison between hospitals.
Because not all hospitals offer all procedures, we grouped by code and looked at the most expensive hospital for each code. For each code, we took the top 10 priciest hospitals.
Out of all 70 codes, Mary Lanning Healthcare appeared in the top 10 most expensive for 37 of them. Enjoy a list of the seven most expensive hospitals:
For this and the remaining charts, you can click to reveal the code used to work with our data.
Click to see code
# First of all -- go to https://www.dolthub.com/repositories/dolthub/hospital-price-transparency-v3 and clone the respository -- then export it to CSV with:
# dolt table export prices prices.csv

import polars as pl
from polars import col
pl.__version__

cms_codes = pl.read_csv('70_shoppables_with_medicare.csv', dtype = {'code': int})
cms_codes.head()

ignored_payers = '|'.join([
    'maximum',
    'minimum',
    '^max$',
    '^min$',
])

codes_included = '|'.join([
    '\\b\d{5}\\b', #..................... 65580 BUT NOT 65880-12
    '\\b\d{3}\\b', #..................... 312 and BUT NOT 12-312 or 123-12
    '\\b\d{5}-\s?\d{5}\\b', #............ 10012-69999
    '\\b\d{3}-\s?\d{3}\\b', #............ 123-127
])

codes_excluded = '|'.join([
    '\\bndc\\b', #........................ NDC <anything>
    '\\beapg\\b', #....................... EAPG <anything>
    '\d+-\d+-\d', #....................... 1234-1234-12 (any 10-digit string with two dashes)
    '\d{10}', #........................... 10-digit str
    '\\bgrams\\b', #...................... usually a drug
])

words_to_erase = '|'.join([
    '\\b[a-zA-Z][0-9]{4}\\b', #........... Q1234
    '\\b[0-9]{4}[a-zA-Z]\\b', #........... 1234Q
    '\\b(\w+-){2,}\w\\b', #............... XXX-XX-XXXXX
    '(\\b\d{1,2}|\\b\d{4,})-\d{3}\\b', #.. 1-123, 2-123, 12345-123
    '\\b\d{3}-(\d{1,2}\\b|\d{4,}\\b)', #.. 123-12, 123-1234
    '(\\b\d{1,4}|\\b\d{6,})-\d{5}\\b', #.. 1-12345, 1234-12345
    '\\b\d{5}-(\d{1,4}\\b|\d{6,}\\b)', #.. 12345-123, 12345-1234, 12345-123456
    '[a-zA-Z]+\s?[\d]{1,2}\\b', #......... V12, Version 91
    '[FY|FY\\s|\\s]20[12][0-9]\\b', #..... FY 2021, FY2020, FY 2012, 2012
    '\\b\d{5}-?\w{2}\\b', #............... 13711-GW or 12932-12
    '\\b\d{3}-?\d{1}\\b', #............... 923-1
    '\\b00\d{3}\\b', #.................... 00416
    '\\b\$?\d+\.\d\d\\b', #............... $12.00, 2.00

])

dtype = {'cms_certification_num':str,
         'code':str,
         'internal_revenue_code':str,
         'units':str,
         'code_disambiguator':str}

ql = (pl.scan_csv('prices.csv', dtype = dtype, encoding='utf8-lossy', low_memory = True)

      .filter(
          (col('price') > 0) &
          (col('code').str.contains(fr'{codes_included}')) &
          ~(col('internal_revenue_code') == '0000') &
          ~col('code').str.to_lowercase().str.contains(fr'{codes_excluded}') &
          ~col('payer').str.to_lowercase().str.contains(fr'{ignored_payers}')
      )

      .with_column(
          (col('code')

           # erase bad strings
           .str.replace_all(fr'{words_to_erase}', ' ')

           # remove any non-digit characters except dashes and replace with spaces
           .str.replace_all(r'[^\d-]+', ' ')
           .str.strip()

           # replace any dashes with space by ordinary dashes,
           .str.replace_all(r'\s?-\s?', '-')

           # split into a string based on spacing
           .str.split(' ')
           .alias('code_extracted'))
      )

      .explode('code_extracted')

      .with_column(
          # remove leading dashes and trailing dashes
          col('code_extracted').str.replace_all(r'^(-)+|-+$', ' ').str.strip()
      )

      .filter(col('code_extracted').str.lengths() > 0)
     )

df = ql.collect()

df_n = df.filter(~col('code_extracted').str.contains('-'))
df_r = df.filter(col('code_extracted').str.contains('-'))

# "normal" dataframe -- no ranges (indicated by dash)
df_n = (df_n
        .with_column(
            col('code_extracted').cast(pl.Int64))
        .filter(pl.col('code_extracted').is_in(cms_codes['code']))
       )

cms_codes_set = set(cms_codes['code'])

def get_valid_codes(struct: dict) -> list:
    code_list   = set(range(struct['init'], struct['final'] + 1))
    valid_codes =  list(set.intersection(cms_codes_set, code_list))
    return valid_codes if valid_codes else [0]

df_r = (df_r
        .with_column(
            col('code_extracted').str.split('-')
         )
         .with_columns([
             col('code_extracted').arr.first().cast(int).alias('init'),
             col('code_extracted').arr.last().cast(int).alias('final'),
         ])
         .with_column(
             pl.struct(['init', 'final']).apply(get_valid_codes).cast(pl.List(pl.Int64)).alias('code_extracted')
         )
         .drop(['init', 'final'])
         .filter(col('code_extracted').arr.first() != 0)
         .explode('code_extracted')
        )

# Finally, put the two dataframes together
df = pl.concat([df_r, df_n])

print(f'Total rows (prices): {len(df)}')
print(df.head())

hospitals = pl.read_csv('hospitals.csv', dtype = dtype)

# Look at insurer prices only
df_insurer = (df
              .filter(col('payer') != 'GROSS CHARGE')
              .filter(col('payer') != 'CASH PRICE')
              .groupby(['cms_certification_num', 'code_extracted'])
              .agg(col('price').mean().alias('mean_price'))
             )


hosp_top_10 = (df_insurer
               .groupby('code_extracted')
               .agg([
                   col(['cms_certification_num', 'mean_price']).sort_by('mean_price').tail(10),
                   col('mean_price').sort_by('mean_price').tail(10).rank('dense', reverse = True).alias('rank'),
                   pl.count(),
               ])
               .explode(['cms_certification_num', 'mean_price', 'rank'])
               .join(hospitals, on = 'cms_certification_num')
               .join(cms_codes, right_on = 'code', left_on = 'code_extracted')
               .select(['code_extracted', 'rank', 'count', 'description', 'mean_price', 'name', 'city', 'state', 'cms_certification_num', 'chargemaster_url'])
               .sort(['code_extracted', 'mean_price'])
              )

# Show the top 10 hospitals for each code, and rank
hosp_top_10.sort('count').head(10)

print(hosp_top_10['name'].value_counts()[:10].to_pandas().set_index('name').to_markdown())| name | state | times in top 10 |
|---|---|---|
| MARY LANNING HEALTHCARE | NE | 37 |
| ADVENTHEALTH CONNERTON | FL | 20 |
| NORTH FLORIDA REGIONAL MEDICAL CENTER | FL | 17 |
| SONOMA VALLEY HOSPITAL | CA | 17 |
| PORTSMOUTH REGIONAL HOSPITAL | NH | 16 |
| FORT WALTON BEACH MEDICAL CENTER | FL | 14 |
| TWIN CITIES HOSPITAL | FL | 14 |
Profits, like sausages#
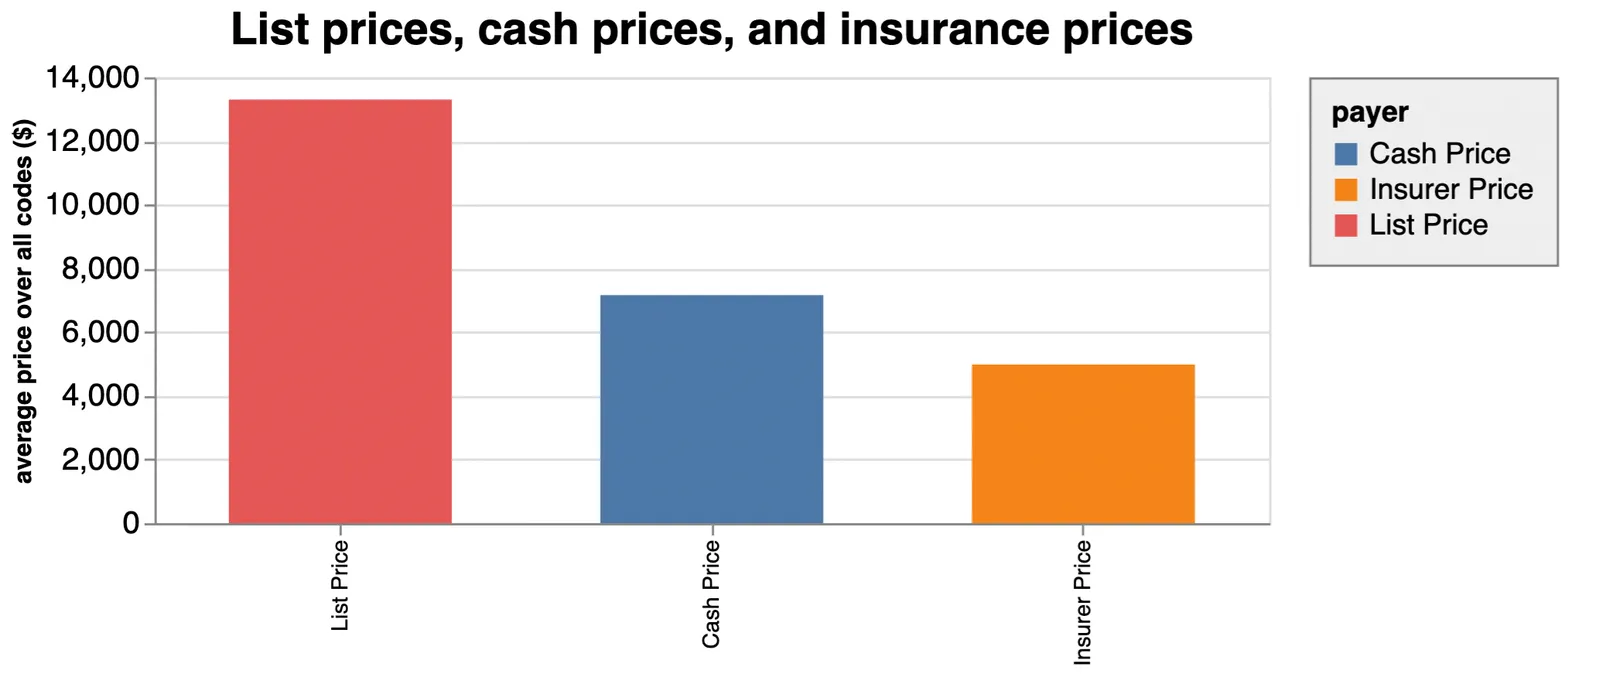
Hospitals are required to publish list prices, cash prices, and insurance prices for each code. “List prices” are made up by the hospitals themselves and are essentially so high as to never be paid. List prices are almost three times the price of what insurers actually pay on average. Cash prices — what you’d pay without any insurance at all — are the highest prices that a person will pay for a procedure, but they are still only about half of the list price.
Hospital pricing is a dark art. Like sausages, it’s tough to figure what goes the prices if you don’t already know. On top of that, the list prices are astonishingly high. Imagine going to a car dealership and settling on a car. The sticker price is $10,000, but sells for $5,000 cash, or $2,500 with a dealer membership card. Of course, you can choose to buy a car and only rarely what surgeries you get, but you get the idea.
Click to see code
import altair as alt

alt.data_transformers.disable_max_rows()

# https://www.optumcoding.com/upload/docs/2021%20DRG_National%20Average%20Payment%20Table_Update.pdf
# https://revcycleintelligence.com/news/medicaid-physician-reimbursement-rates-lag-medicare

def dolthub_theme():
    return {
        'config': {
            'legend': {
                'labelLimit': 700,
                'strokeColor': 'gray',
                'fillColor': '#EEEEEE',
                'padding': 10,
            },
        }
    }
alt.themes.register('dolthub_theme', dolthub_theme)# enable the newly registered theme
alt.themes.enable('dolthub_theme')

df1 = (df1.groupby(['code_extracted']).agg(col('price').mean())).with_column(pl.lit('List Price').alias('payer'))
df2 = (df2.groupby(['code_extracted']).agg(col('price').mean())).with_column(pl.lit('Cash Price').alias('payer'))
df3 = (df3.groupby(['code_extracted']).agg(col('price').mean())).with_column(pl.lit('Insurer Price').alias('payer'))

df4 = (pl.concat([df1,df2,df3])
       .join(cms_codes, left_on = 'code_extracted', right_on = 'code'))

source = df4.groupby('payer').agg(col('price').mean()).to_pandas()

chart = alt.Chart(source).mark_bar(size = 100).encode(
    x=alt.X('payer:N', title = '', sort = '-y'),
    y=alt.Y('price:Q', title = 'average price over all codes ($)'),
    color='payer:N',
).configure_legend(
    orient = 'right'
).properties(
    width = 500,
    title={
      "text": ["List prices, cash prices, and insurance prices"],
    }
).configure_title(
    fontSize = 20,
    anchor = 'middle',
    subtitleFontSize = 18,
    subtitleColor = 'gray',
)

chart
But apart from making getting carpal tunnel feel like going to a car dealership, these fictitious prices serve the interests of the hospital and insurers alike.
False losses, false profits#
First, insurance companies can use these discounts to advertise savings on their networks. Cost savings attract customers.
Second, any procedure an underinsured patient fails to pay for may in many cases be classified as a “community benefit” by a nonprofit hospital. The difference between what the hospital charges for a procedure and what they get from Medicaid is logged as a loss. Hospitals can pad their charitable benefits this way and generate tens of millions of dollars in losses that help them to keep their tax perks.
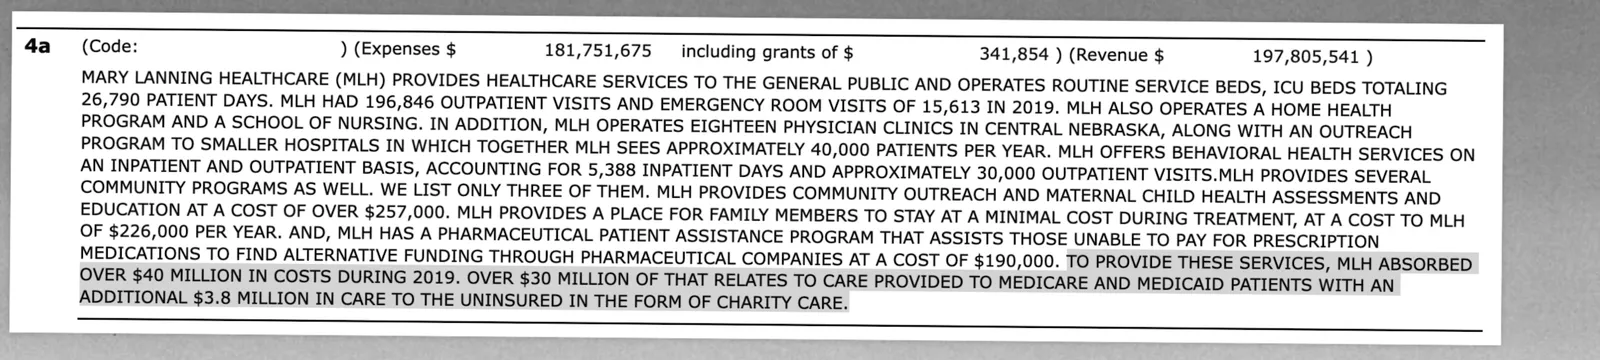
Mary Lanning Healthcare logged over $30,000,000 in “losses” this way in 2019. It is impossible to know how much they actually spent, or even if they actually lost money on these procedures. But the inflated “list prices” allow them to say things like:
While MLH tries to provide competitive pricing, we do understand that healthcare in general is high. That’s why, in 2016, MLH provided $40 million in charity care.
Supporting the idea that list prices exist only as a legal fiction, a 2020 analysis found that even though the amount of charitable work stayed roughly constant from 2001-2011, the supposed “cost” of charity care more than doubled over the same period, suggesting that hospitals are doing the same work and losing more money.
The idea has been floated that high prices exist as a way of offsetting low Medicare/Medicaid payments — a practice known as cost shifting — but the evidence for that is mixed. In fact, many hospitals raise their rates when Medicare prices going up, rather than down. In any case, it is impossible to know how much hospitals make or lose without knowing their true costs, which their list prices exaggerate. The list prices can be dozens of times higher than the rates paid to the hospitals by government programs.
Although we only have data for one year, in the chart below we can see how “list prices” compare to the prices paid by Medicaid, and how hospitals (most of which are nonprofit) can easily write off millions of dollars in losses.
Click to see code
source = (df
          .filter(col('payer') == 'GROSS CHARGE')
          .with_column(
              col('price').mean().over(['code_extracted', 'cms_certification_num']).alias('mean_code_price')
          )
          # filter out prices which might be outliers (not necessary, results stay same)
          .filter(col('price') < 2*col('mean_code_price'))
          .filter(col('price') > .5*col('mean_code_price'))
          .groupby(['code_extracted', 'cms_certification_num']).agg(col('price').mean())
          .join(cms_codes, left_on = 'code_extracted', right_on = 'code')
          .filter(col('price') > 1)
          .filter(col('price') < 1_000_000)
          .with_column(
              (col('facility_rate')*.72).alias('estimated_medicaid_rate')
          )
          # remove sample to increase number of points
          .sample(10_000)
          .to_pandas())

# MCC = major complications or comorbidities
# CC = complications or comorbidities

payers = (
    alt.Chart(source,
             )
    .mark_tick(
        opacity = .5,
        size = 10,
    )
    .encode(
        x=alt.X(
            title = 'procedure list price (colored), est. Medicaid price (black) ($)',
            field = 'price',
            scale = alt.Scale(type ='log'),
        ),
        y=alt.Y(
            # title = '',
            field='description',
            sort = cms_codes.sort('kind')['description'].to_list(),
        ),
        color=alt.Color('kind', title ='Procedure type', legend=alt.Legend(symbolOpacity=1)),
    )
)

medicare = (
    alt.Chart(source)
    .mark_point(
        color = 'black',
        filled = True,
        size = 40,
    )
    .encode(
        x=alt.X(
            # field = 'facility_rate',
            field = 'estimated_medicaid_rate',
            scale = alt.Scale(type ='log', domain = (1, 1_000_000))
        ),
        y=alt.Y(
            title = '',
            field='description',
            sort = cms_codes.sort('kind')['description'].to_list(),
        ),
    )
)

chart = payers + medicare

chart = (chart
         .properties(
                 title={
                      "text": ['"List prices" and Medicaid prices'],
                      "subtitle": ['Hospital list prices for 70 common services (logarithmic scale)',
                                   'Each tick is a different price',
                                   'Estimated Medicaid price as black dot, when available']
                    },
             width = 800,
         )
         .configure_title(
            fontSize = 25,
            anchor = 'middle',
            subtitleFontSize = 20,
            subtitleColor = 'gray',
         ).configure_legend(
             labelFontSize = 13,
             titleFontSize = 13,
             orient = 'top-right',
         ).configure_axisY(
             grid = True
         ).configure_axisLeft(
             labelFontSize = 14,
             labelLimit = 700,
         ).configure_axisBottom(
             titleFontSize = 20,
         )
)

chart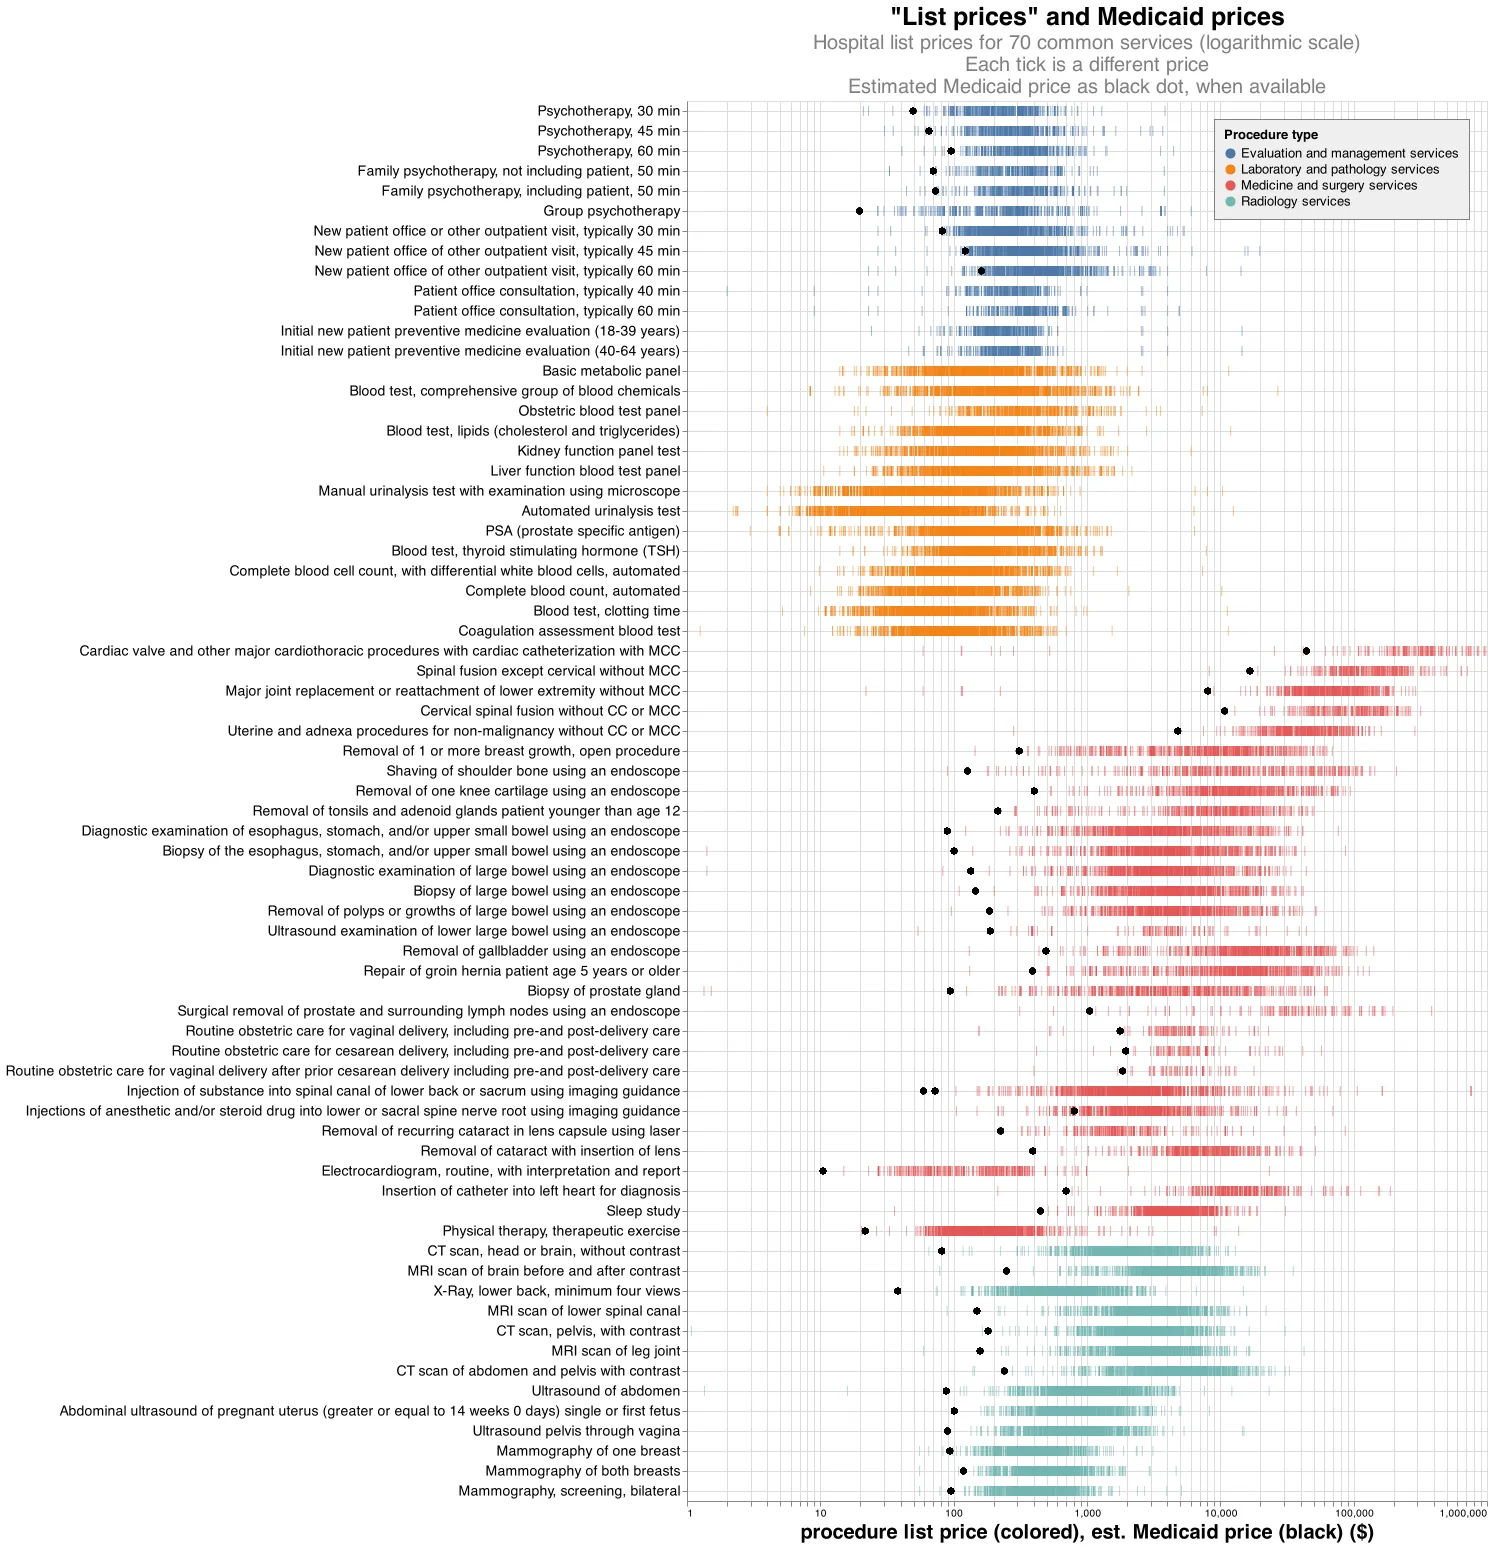
The data suggest that hospitals are relying on this special exemption to airbrush their reputations as charity organizations, when on average for-profits may be just as charitable when nonprofits are stripped of these fictitious losses.
If you can’t beat them…#
Interestingly, Kearney Medical Center, the cheaper hospital we mentioned earlier, recently got bought by a nonprofit hospital group. As part of a nonprofit, Kearney can exempt itself from taxes, provided it offers enough community benefits.
But will this result in kickbacks to the community, or just higher sticker prices?
Even Mary Lanning Healthcare blogs about their high prices:
Still skeptical because of the big bill your dad got last year from MLH? Hear things in the community like, “Mary Lanning is just so expensive?”
We are indeed skeptical. As we have seen, nonprofit hospitals can leverage their fictitious list prices to enhance their community benefits. When these benefits are subtracted off, they don’t actually give much back. This is like getting to make up business expenses that are so high that they zero out your income tax. A few solutions come to mind:
- Stop counting Medicaid write offs as a community benefit and let hospitals accept these patients at their discretion
- Audit a hospital’s true costs per procedure
Of course, as some of the largest employers in the country, many nonprofit hospitals would serve the community better by simply paying taxes.
We encourage a second look at nonprofit hospitals, and specifically more data transparency from hospitals, especially as a number of hospitals and even insurance companies are having their nonprofit status challenged.
We also want you to be one of the first to look at our data. Have expertise in medical billing, or strong data analysis chops? Did we make a mistake, or do you have an idea for another blog? Take a look at our database, or write me or chat with me on Discord.