
Dolt is Git for data – it’s a SQL database that lets you clone, branch, diff, merge, and fork your data just like you can with files in Git. R is a programming language designed for statistical computing and data visualization. This blog post shows how easy it is to use Dolt and R together and how the unique distributed versioning features of Dolt can help you cleanly work with your data as it evolves.
Why Dolt?#
Dolt changes the paradigm for how you work with your data.
The distributed versioning features provided by Dolt are useful in just about any domain and application.
For example, some of our customers are using Dolt in OLTP use cases as a drop-in replacement for MySQL to
back their applications,
others are embedding Dolt in products to provide application features like versioning, and other customers are using it for
reproducible modeling and analysis.
In addition to the Dolt database, we also built DoltHub – a place where you can find and collaborate on tons of interesting datasets. There’s a wide variety of public datasets available, and with a DoltHub Pro account, you can create private databases for you and your organization, too. Some of the most interesting and unique datasets on DoltHub come from Bounties, where we crowdsource building various datasets.
Dolt and R in Action 🚀#
So, now that you know what Dolt is and why you should consider it for your datasets, let’s take a look at an example of using a Dolt database from within R…
To follow along, you’ll need to set up a few tools on your system:
DoltR - An easy to use R package#
Because Dolt is a SQL database with MySQL compatibility, you could use the dolt sqlserver command to spin up
a SQL server, and then use the standard DBI packages from R and a MySQL driver to query your Dolt database.
This is pretty straightforward, but I want to highlight an even easier way to access your Dolt databases from
R applications – DoltR, an
R package created at EcoHealth Alliance that makes it super easy to connect to Dolt databases.
Before you can use the DoltR package, you’ll need to install it from GitHub into your local R workspace. Open up R Studio and run these lines in the R Studio console window:
library(remotes)
remotes::install_github("ecohealthalliance/doltr")
Visualizing Iris Data 📊#
For this introductory example, we’re going to use the Iris dataset – a classic dataset for learning data visualization and an easy one to work with. It provides data on petal and sepal measurements for three types of irises.

After you get your tools set up, clone my fork of the Iris database from DoltHub to your local workspace:
cd ~/Projects/DoltRepos/
dolt clone jfulghum/iris-flower-dataset iris_flower_dataset
Note: In the command above, I supplied a clone destination directory to replace hyphens with underscores to make sure the DoltR package can easily find our database.
Once you’ve got the dataset cloned to your system, go back to R Studio and select File -> New File -> R Script
to create a new R Script and add the code below.
library(DBI)
library(ggplot2)
# Set this to the path to your Dolt command line executable so DoltR can find it
Sys.setenv(DOLT_PATH = "/opt/homebrew/bin/dolt")
# Create a DB connection using the DoltR driver
myconn <- dbConnect(doltr::dolt_local(),
dir= "/Users/jason/Projects/DoltRepos/iris_flower_dataset")
iris_measurements <- dbGetQuery(myconn, "SELECT * FROM classified_measurements;")
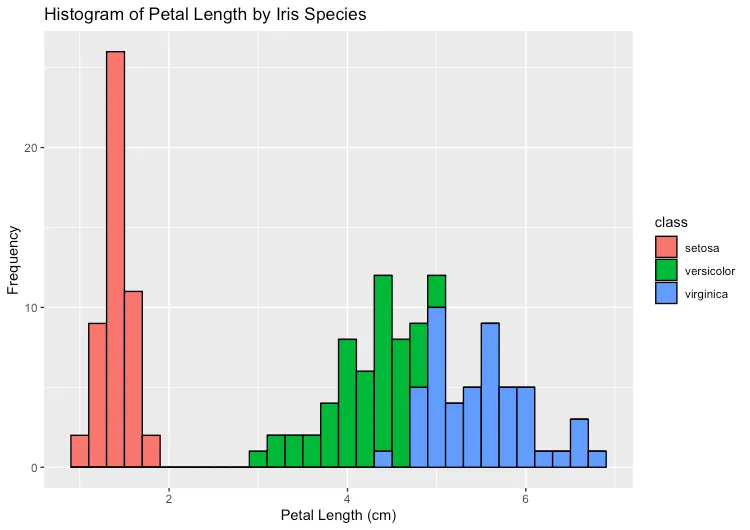
# Stacked Histogram by iris type
ggplot(data=iris_measurements) +
geom_histogram(binwidth=0.2, color="black", aes(x=petal_length_cm, fill=class)) +
xlab("Petal Length (cm)") + ylab("Frequency") + ggtitle("Histogram of Petal Length by Iris Species")Select all the statements in your new R Script file and hit the Run button in R Studio and you should see
a stacked histogram of iris petal length, categorized by the three types of irises in the dataset:
Try exploring the iris dataset more. Can you plot a stacked histogram for other measurements?
Try using the geom_bin2d function instead of geom_histogram to generate a two-dimensional histogram
that visualizes the frequency of two continuous variables (e.g. petal_length_cm and petal_width_cm)
as a heatmap. Experimenting with other values for the binwidth parameter is a good way to look at
your data with different granularity.
Branching Data Workflow#
Next, let’s take a look at how we can use some of Dolt’s distributed versioning features through DoltR.
I’ve been collecting measurements on a fourth species of iris, Iris pseudacorus, or yellow iris.
I want to add this fourth species to our database, but I don’t want to add it directly to the main branch yet.
So, while collecting and validating measurements, I created a branch called fulghum/iris-pseudacorus by running the
dolt checkout -b fulghum/iris-pseudacorus command on my Dolt repo. This gives me an isolated branch where I can
add my measurements and validate them, before I eventually push them back to the default main branch when I’m
ready to share this data with other people.
In order to visualize this new data on the fulghum/iris-pseudacorus branch, we’ll need to check out a branch
in our R script.
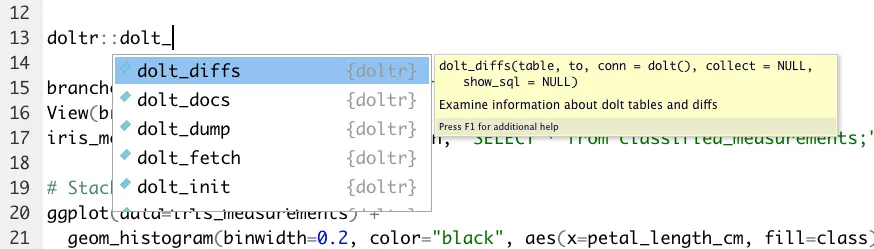
The DoltR package provides many functions that let you access Dolt’s unique distributed versioning
functionality easily from within R scripts (e.g. dolt_clone, dolt_commit, dolt_branches, dolt_pull).
R Studio autocomplete makes it easy to explore the available DoltR functions and you can also find them
documented online.
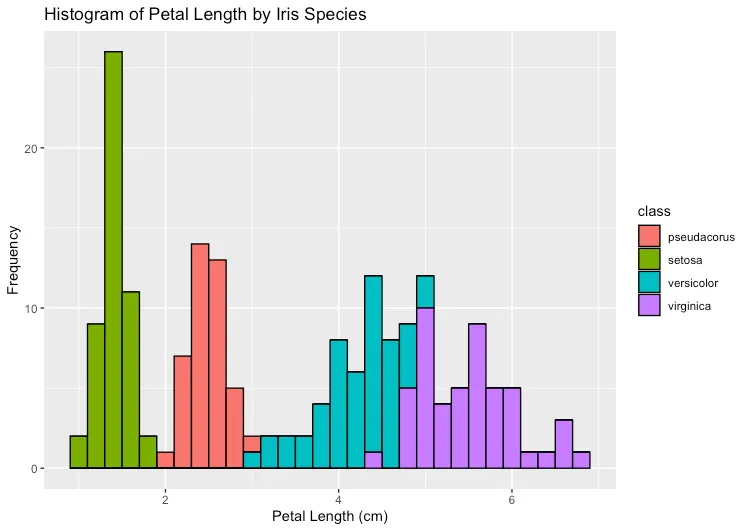
In the updated R script below, notice the new line that calls the doltr::dolt_checkout function to use
our new branch so we can see the additional iris species data in our visualization.
library(DBI)
library(ggplot2)

# Set this to the path to your Dolt command line executable so DoltR can find it
Sys.setenv(DOLT_PATH = "/opt/homebrew/bin/dolt")

# Create a DB connection using the DoltR driver
myconn <- dbConnect(doltr::dolt_local(),
                    dir= "/Users/jason/Projects/DoltRepos/iris_flower_dataset")

# DoltR provides access to Dolt functions for cloning, pushing, pulling, and much more.
# In our example, we're checking out a branch to visualize the new data we're working on.
doltr::dolt_checkout("fulghum/iris-pseudacorus", conn=myconn)

iris_measurements <- dbGetQuery(myconn, "SELECT * FROM classified_measurements;")

# Stacked Histogram by iris type
ggplot(data=iris_measurements) +
  geom_histogram(binwidth=0.2, color="black", aes(x=petal_length_cm, fill=class)) +
  xlab("Petal Length (cm)") +  ylab("Frequency") + ggtitle("Histogram of Petal Length by Iris Species")
Now when we run our script, we see our chart includes the Iris pseudacorus data from our branch.
This example shows how we can use some of Dolt’s distributed versioning features to manage how we work with our data.
Instead of making changes directly to the main dataset, or passing around copies of the dataset, all of our changes
are tracked together in a single Dolt database where we can easily switch between the current production view (main)
and an active development view (fulghum/pseudacorus). The provenance of that data is tracked in the database
and we’ll always be able to view that history and track back where the data came from.
Conclusion#
Hopefully this introductory blog post shows you how easy it is to access Dolt databases from R applications and why you should consider Dolt for your own datasets.
We’ve only scratched the surface of what you can do with Dolt and R! For example… you can imagine more sophisticated analysis where R applications query Dolt system tables to directly access Dolt’s version metadata and visualize not just the most recent dataset, but also how that dataset has grown and changed over time, who has updated it, etc.
Try out Dolt and the DoltR R package today. You can find lots of interesting datasets on DoltHub to work with.
Are you a researcher or data scientist interested in using Dolt’s distributed versioning features? We’d love to hear from you! Come join us on Discord!