
It seems like every other week one of the frontier AI labs announces a new flagship model. These announcements always come with claims that their new model outperforms its competitors by a wide margin. These claims are then “proven” with fun graphs that show how much better and cheaper the new model is than whatever you were using before. Here’s one such graph from this week’s announcement of GPT 6.2 Astra and Sol.
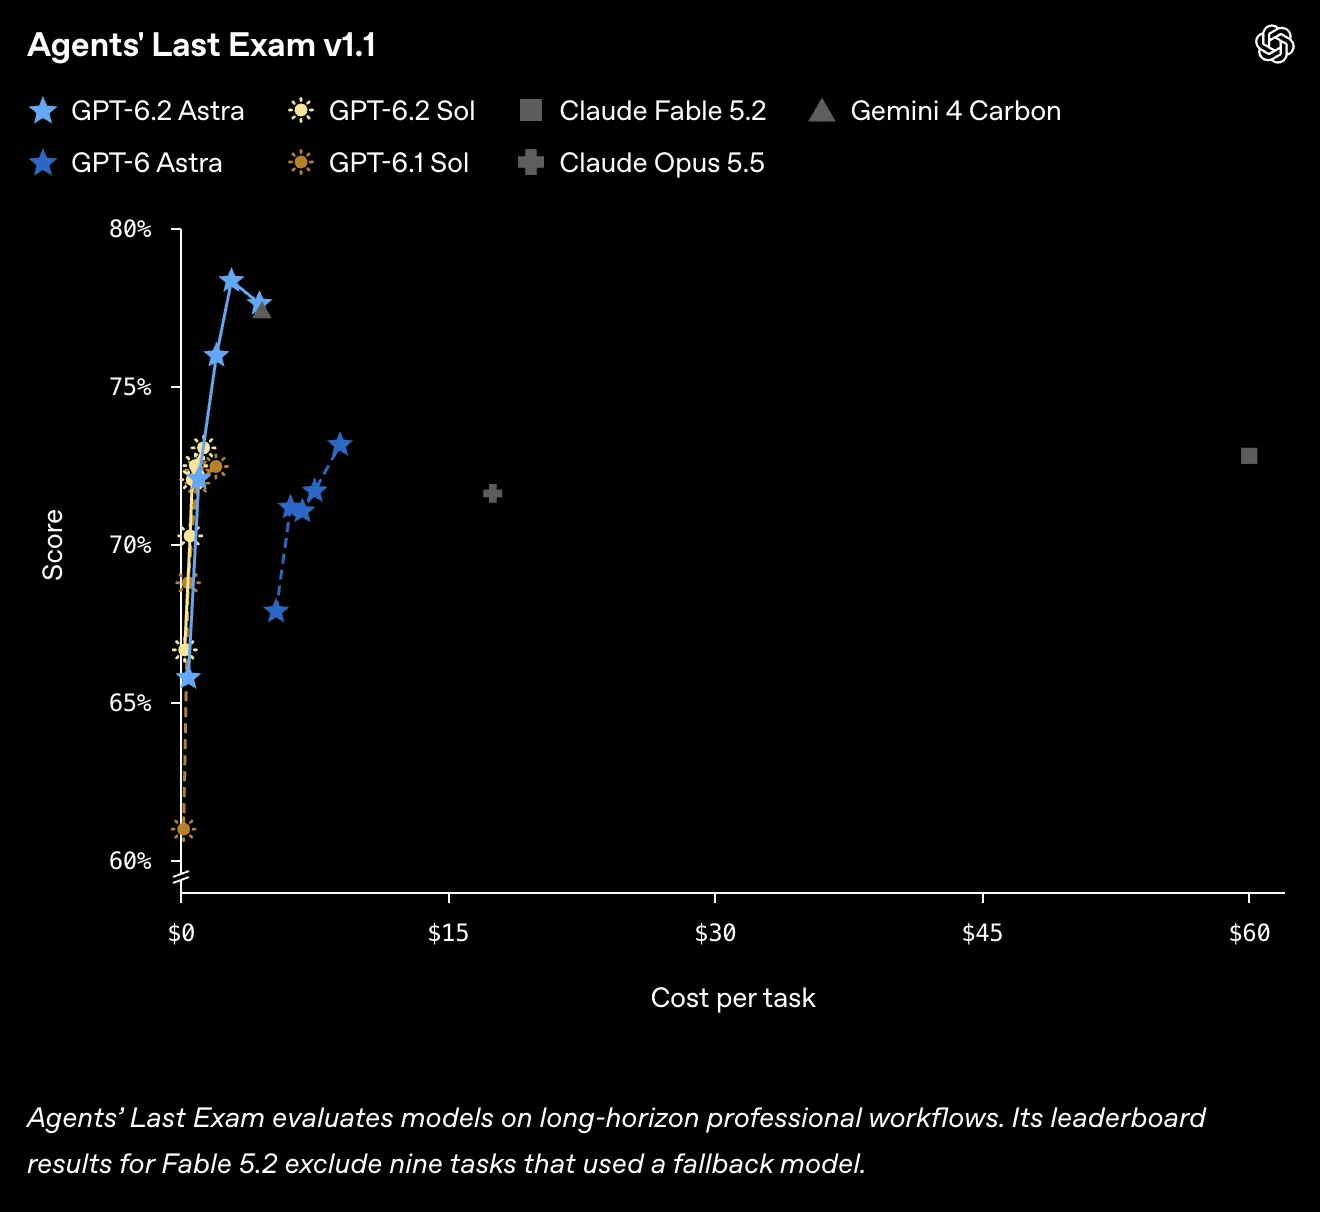
This graph highlights Astra’s performance on the Agents’ Last Exam benchmark, which, as OpenAI graciously informs us in the text below the figure, evaluates models on “long-horizon professional workflows.” When I read this announcement, my first thought was not “wow, this new model must be exceptional.” It was “what the hell is a long-horizon professional workflow?”
From the outside, the benchmarks used to judge models range from vague to indecipherable. At DoltHub we build databases, and lots of people these days are pointing agents at them. In an effort to better understand the current state-of-the-art agentic SQL benchmarks and dispel some of the mystique surrounding benchmarks in general, I dug into the internals of several of the more popular SQL benchmarks used to evaluate models. These are my findings.
A Brief History#
One of the first major SQL benchmarks came before we had general-purpose models like those created by OpenAI and Anthropic. In 2018, Yale researchers came out with Spider, a dataset consisting of 10,000+ natural language questions corresponding to handwritten SQL queries. An example question-answer pair from Spider 1.0 looked something like this:
Schema:

stadium(stadium_id, location, name, capacity, highest, lowest, average)
singer(singer_id, name, country, song_name, song_release_year, age, is_male)
concert(concert_id, concert_name, theme, stadium_id, year)
singer_in_concert(concert_id, singer_id)

Question:

What are the names of the stadiums without any concerts?
-- Answer:
SELECT name FROM stadium WHERE stadium_id NOT IN (SELECT stadium_id FROM concert);At the time, the types of models evaluated on Spider were specifically trained on Spider’s data and tested on a set of databases they’d never seen, which forced them to generalize to new schemas. In the original paper, the best-performing model scored only 12.4%. By the time the Spider 1.0 leaderboard closed in 2024, that number had shot up to over 80%.
By 2023, the rise of general-purpose models made Spider-like benchmarks less meaningful. The original BIRD benchmark functioned as a spiritual successor to Spider 1.0, with messier, more realistic data, but the format was largely the same. The one-shot text-to-SQL system that worked for evaluating specialized machine learning models was not geared toward the humanlike engineering tasks targeted by generalized LLMs like Claude and ChatGPT. Models could now operate in “agentic” loops, where they repeatedly run queries, read the results, and try again. At this point, Spider 1.0 was solved. Its creators closed the leaderboard, and later that year pointed everyone to Spider 2.0, which dropped agents into complex, enterprise-like databases. On Spider 2.0’s release in late 2024, the best models scored only 21%.
The Landscape#
Today, the landscape around agentic SQL benchmarks has split off in several different directions. Some test an agent’s ability to navigate and understand enormous databases. Some give agents vague requests and require them to use their environment to clarify requirements. Some test DBA-related tasks, like keeping a database running and diagnosing issues. Some test ETL tasks, which require pulling from sources and mapping data to tables.
It’s pretty clear that the core tasks have evolved from one-shot SQL generation to more realistic problems. I investigated several of these benchmarks and picked five of the more interesting ones.
Spider 2.0#
Spider 2.0 is the follow-up to the original Spider benchmark, and it comes with a sharp jump in difficulty. There’s no longer a simple four-table schema paired with a straightforward answer query. Instead, agents are given real Snowflake, BigQuery, DuckDB, and SQLite databases, often with upwards of 1,000 columns. They also have access to documentation that is usually necessary to solve the problem. Here’s an example from the real benchmark:
/*
Question:

How many distinct pseudo users had positive engagement time in the 7-day period
ending on January 7, 2021 at 23:59:59, but had no positive engagement time in
the 2-day period ending on the same date (January 7, 2021 at 23:59:59)?
*/
-- Answer:
SELECT
  COUNT(DISTINCT MDaysUsers.user_pseudo_id) AS n_day_inactive_users_count
FROM
  (
    SELECT
      user_pseudo_id
    FROM
      `bigquery-public-data.ga4_obfuscated_sample_ecommerce.events_*` AS T
    CROSS JOIN
      UNNEST(T.event_params) AS event_params
    WHERE
      event_params.key = 'engagement_time_msec' AND event_params.value.int_value > 0
      AND event_timestamp > UNIX_MICROS(TIMESTAMP_SUB(TIMESTAMP('2021-01-07 23:59:59'), INTERVAL 7 DAY))
      AND _TABLE_SUFFIX BETWEEN '20210101' AND '20210107'
  ) AS MDaysUsers
LEFT JOIN
  (
    SELECT
      user_pseudo_id
    FROM
      `bigquery-public-data.ga4_obfuscated_sample_ecommerce.events_*` AS T
    CROSS JOIN
      UNNEST(T.event_params) AS event_params
    WHERE
      event_params.key = 'engagement_time_msec' AND event_params.value.int_value > 0
      AND event_timestamp > UNIX_MICROS(TIMESTAMP_SUB(TIMESTAMP('2021-01-07 23:59:59'), INTERVAL 2 DAY))
      AND _TABLE_SUFFIX BETWEEN '20210105' AND '20210107'
  ) AS NDaysUsers
ON MDaysUsers.user_pseudo_id = NDaysUsers.user_pseudo_id
WHERE
  NDaysUsers.user_pseudo_id IS NULL;
Spider-2.0 is still fundamentally a text-to-SQL benchmark, but the route one must take to arrive at a correct answer is multi-stepped and requires agentic reasoning. Grading also works by execution, rather than exact-match SQL. In the example above, the correct answer is 12212.
Most people use Spider-2.0-lite, which is a smaller version with 547 tasks like the one above. When the paper came out in 2024, the best method scored 12.6%. Now, the top score is 76.2%.
BIRD-Interact#
Spider-2.0 ensures that all problems are solvable with the information at hand. BIRD-Interact is unique in that it makes no such assurances. The problems are structured similarly to Spider’s, but requisite information is deliberately withheld. The problems are set up in a way that requires the agent to realize that it cannot complete the task without clarification. For example, here’s the starting prompt for a BIRD-Interact task:
Please find all the customer IDs who are highly digital.There’s no way for any agent to understand what “highly digital” means in this context without following up with the user. If the agent asks for clarification, the benchmark provides a response from the simulated user. The simulated user in this example knows that the intent behind the original prompt was:
Please find all the customer IDs that meet the 'Digital First Customer' criteria.The definition for ‘Digital First Customer’ has been deleted from the agent’s knowledge base, so the only way to get it is to ask. That missing entry looks like this:
{
    "knowledge": "Digital First Customer",
    "description": "Identifies customers who primarily engage through digital channels.",
    "definition": "A customer with chaninvdatablock.onlineuse of 'High' or chaninvdatablock.mobileuse of 'High', and chaninvdatablock.autopay of 'Yes'."
}
Like Spider 2.0, answers are scored via execution. For BIRD-Interact, answers aren’t public, but the benchmark’s annotations include these fragments:
SELECT bankexpref ...
WHERE (chaninvdatablock->>'onlineuse' = 'High' OR chaninvdatablock->>'mobileuse' = 'High')
  AND chaninvdatablock->>'autopay' = 'Yes'
The paper states that agents preferred “costly trial-and-error over strategic resource exploration.” The top score at the time was GPT-5, which completed 17% of the tasks. The best agent on the leaderboard today still only completes about 25%.
LiveSQLBench#
LiveSQLBench is built by the same team behind BIRD-Interact, and it’s unique in two different ways. First, its data is refreshed over time. The goal of this is to prevent benchmark data from entering a model’s corpus, making it harder for models to memorize the answers. Second, many LiveSQLBench tasks require agents to actually change the database, rather than just reading it. Here’s an example question with a fragment from the answer:
/*
Question:

Flag all signals with poor quality by updating their SignalClass to 'Weak' when
they have a negative Signal-to-Noise Quality Indicator (SNQI) value.
*/

-- Answer:
SET SignalClass = 'Weak'
WHERE (SnrRatio - 0.1 * ABS(NoiseFloorDbm)) < 0
Again, SNQI isn’t a column in a table anywhere. The agent has to explore its environment to determine how to solve the problem. For scoring, read-only tasks are graded by execution accuracy, and write tasks by inspecting the state of the database afterward. LiveSQLBench launched in 2025 with a top score around 25%, and it’s now up to 57%.
DataAgentBench#
DataAgentBench, developed out of UC Berkeley, spreads tasks across multiple database systems. To solve a problem, an agent might need to combine results across PostgreSQL, SQLite, DuckDB, and MongoDB databases. Here’s an example:
Question:

Which decade of publication (e.g., 1980s) has the highest average rating
among decades with at least 10 distinct books that have been rated?
Return the decade with the highest average rating.

Answer:
2020
For this problem, book information is stored in Postgres, and the reviews are in SQLite. The agent has to pull from both and synthesize them into an answer. Also, the label isn’t a query here. It’s just a value. Questions are graded using scripts that check the agent’s output text.
On release, the best agent in the paper scored 57%. Now, the top five spots on the leaderboard all score over 95%. This is interesting because it means the benchmark is effectively saturated. I’ll elaborate more on that later, but it’s worth looking at how those scores were actually achieved. Each of the top five uses a prompt or harness specifically tuned for DataAgentBench. Also, the benchmark provides an optional “hints” file, and all five use it.
ELT-Bench#
This one is perhaps the most unique because it doesn’t involve answering a question. Instead, ELT-Bench asks agents to build data pipelines. In each of the problems, the source data is scattered across several systems and agents have to extract it. Then, they have to come up with a mechanism for loading that data into a target database (like Snowflake), and write data transformations that map them into the requested tables. Here’s an excerpt from an example task where the agent has to search for data across Postgres, Mongo, S3, a CSV file, and a custom API:
- name: states
  description: Each record represents a state.
  columns:
    - name: county_with_highest_average_income_per_household
      description: the county with the highest average income per household in the
        state, with ties broken by the ascending order of the county
    - name: num_asian
      description: the number of Asian in the state, replace NULL values with 0.
    - name: greater_than_15_CBSA_metro
      description: Set to 1 if the state has greater than 15 distinct CBSA officers
         of metro type, otherwise, set to 0
...
The label is the finished table with the real data:
ABBREVIATION,NAME,COUNTY_WITH_HIGHEST_AVERAGE_INCOME_PER_HOUSEHOLD,NUM_ASIAN,NUM_COUNTIES,HIGHER_AVG_FEMALE_PER,GREATER_THAN_15_CBSA_METRO
NH,New Hampshire,ROCKINGHAM,34525,10,0,0
RI,Rhode Island,BRISTOL,36763,5,1,0
NC,North Carolina,CHATHAM,252585,100,1,1
Models are evaluated against two criteria: loading data and building the tables correctly. On release, the best agent loaded data successfully 73% of the time and built tables correctly only 11% of the time. ELT-Bench doesn’t have an ongoing leaderboard system like the other benchmarks.
There were also errors with labeling and evaluation in the original benchmark that were eventually fixed in a follow-up paper titled ELT-Bench-Verified. This paper states that “re-evaluating ELT-Bench with upgraded large language models reveals that the extraction and loading stage is largely solved, while transformation performance improves significantly”. Even with the corrected benchmark, though, agents still scored only 33% on the table-building metric.
Problems#
Although models are constantly improving their scores, these benchmarks are not flawless. The main issues come in four different categories:
Grading#
Determining whether an answer is “correct” is a decidedly difficult problem. The earliest benchmarks scored models based on exact-match SQL production. That is, the questions came with labeled gold queries, and a model’s solution was deemed accurate if it matched the structure of the gold query. This was clearly a flawed system since the solution space for such problems is infinite. Models could generate correct SQL that differed syntactically. Most benchmarks today favor execution accuracy as the scoring metric, where answers are graded by comparing the result set returned by the model with that of the gold query. In this system, false negatives become rarer, but false positives become possible. For a trivial example, consider the following table:
sqlite> SELECT name, age FROM people;
┌──────────────┬─────┐
│     name     │ age │
├──────────────┼─────┤
│ Joe Sharp    │ 52  │
│ Rose White   │ 41  │
│ John Nizinik │ 43  │
│ Ana Ruiz     │ 39  │
└──────────────┴─────┘
Now, suppose the question is “Which people are older than 40?”. Here are two SQL queries that would both return the same three rows.
SELECT name, age FROM people WHERE age > 40;

SELECT name, age FROM people WHERE age >= 40;
One of these is clearly wrong. These sorts of problems, where the construction of the broader dataset lends itself to undetected inaccuracies, present themselves at a much larger, more convoluted scale in real-world benchmarks. Additionally, pure execution accuracy fails to provide any input on the “quality” of the model’s solution. An incredibly complicated, suboptimal query or sequence of queries that results in the correct result set is marked correct.
Labeling#
A paper published in early 2026, Pervasive Annotation Errors Break Text-to-SQL Benchmarks and Leaderboards, found that BIRD Mini-Dev and Spider 2.0-Snow benchmarks contained labeling errors at rates of 52.8% and 62.8%, respectively. After correcting the labels, the authors rescored 16 agents and found that the rankings shuffled, in some cases, by up to nine places.
As mentioned earlier, the original ELT-Bench benchmark was riddled with labeling errors. The follow-up paper, ELT-Bench-Verified, notes that “quality issues are systemic in data engineering evaluation.” This is more a consequence of human error than a flaw in how the benchmarks are designed, but it does very little to improve confidence in SQL benchmarks generally.
Saturation#
The shelf-life of SQL benchmarks over the last few years can often be measured in months rather than years. In other words, models tend to become very good at these benchmarks very quickly. DataAgentBench, for example, went from 57% to 99% in seven months. Spider 2.0-Snow’s top score is sitting at 96.7% today. Once models reach the ceiling of what any given benchmark can measure, the differences between entries become harder to interpret and it’s no longer possible to discern a clear winner.
This is not to say that agents have solved data tasks in general. Consider BEAVER, another text-to-SQL benchmark. From what I can tell, the main factor that differentiates BEAVER from other benchmarks like Spider-2.0 is that its tasks use private data, yet agents perform much worse on it. The best agents on BEAVER scored around 11%.
This disparity between really “easy” benchmarks and really “hard” benchmarks says more about benchmarks than it does about agents. Higher scores only imply that an agent has gotten better at that particular benchmark, not necessarily that it’s gotten better at the job.
Harness vs. Model#
The highest scorer on the official leaderboards for virtually all benchmarks is almost never a model by itself. The top scorer on Spider 2.0-lite is “Tianqiong Data Agent + GLM 5.2.” For LiveSQLBench, it’s “AntQL 1.1 (Claude Opus 5.5).” These are products built on top of models. Each one comes with its own prompts, tools, retry logic, and whatever other features its creator adds to the harness.
As an isolated example, Claude Sonnet 4.5 scores 23.8% on LiveSQLBench by itself and 35.2% when it’s wrapped inside the OpenHands Agent Framework. This makes it quite difficult to judge a model on its own merits.
Conclusion#
Agentic SQL benchmarks have come a long way since Spider. Models are clearly getting better at them. Despite all of this, I remain skeptical about benchmarks in general, and especially so about SQL benchmarks for the reasons outlined above.
Anecdotally, I’ve had much less success using agents for SQL-related tasks than I have for writing code. They love writing complicated queries (especially CTEs) that are often correct by the execution accuracy metric but are certainly not the “gold query” I’d use for labeling. There’s definitely room for improvement in this space.
Benchmarks should, at the very least, be able to tell you which model is best for the task they measure. We’re a database company. We’d like to be able to tell our users which models work best with Dolt. After spending hours researching these SQL benchmarks, I have absolutely no idea which model that might be. That’s a benchmark problem.
If you’re curious about what we’re building at DoltHub, or if you figure out what a long-horizon professional workflow is, come by our Discord and let us know.