
It’s official! Doltgres v1.0 is here!
Alongside various features and correctness improvements, this release comes with some large performance gains.
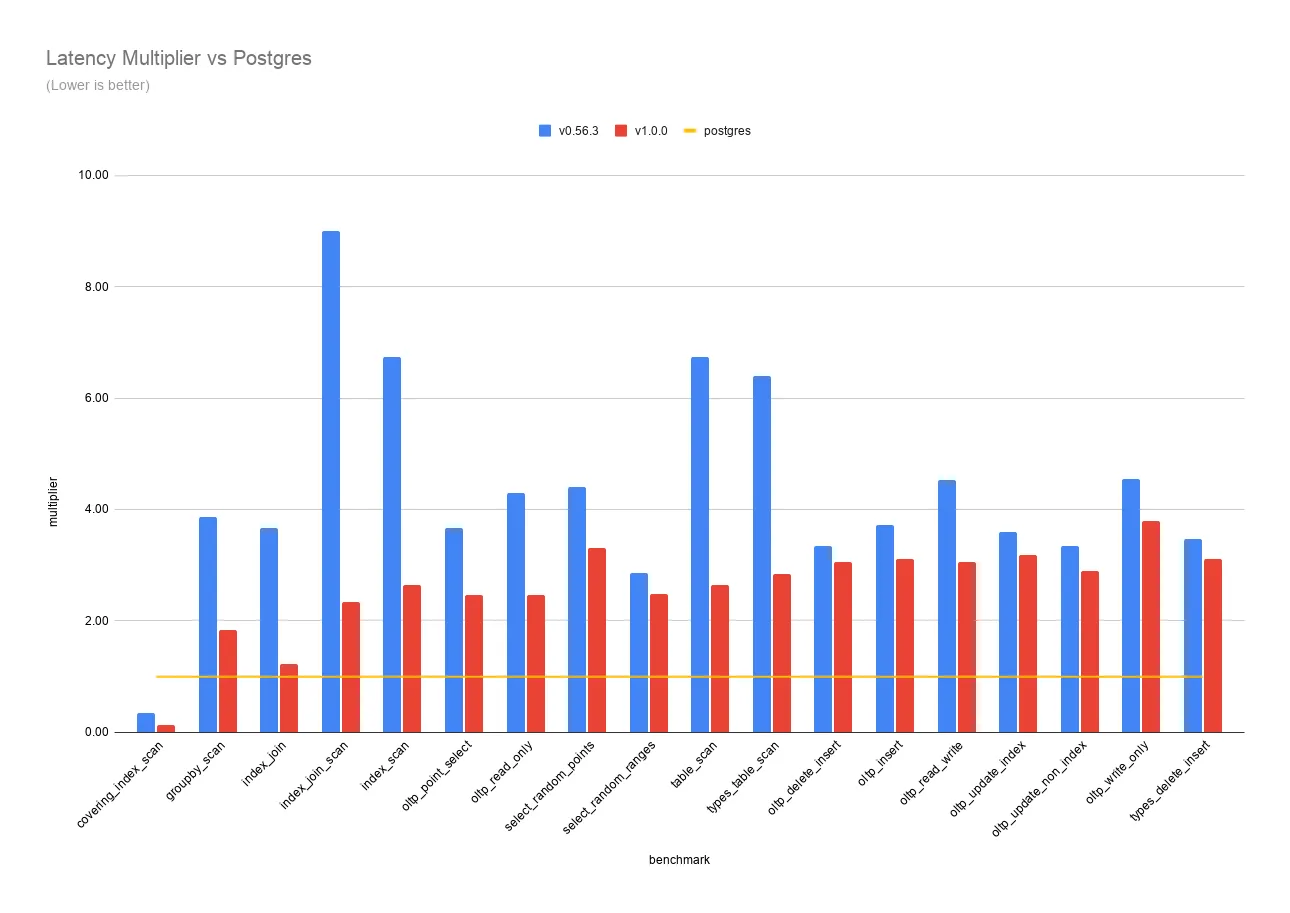
Over the course of a few months, we’ve managed to reduce Doltgres from 4.4x to 2.6x Postgres on sysbench, which is a 1.8x improvement!
Fun fact, MySQL’s average multiplier when compared against Postgres on these same benchmarks is also 2.6x.
This means that Doltgres is as fast as MySQL is slow.
Overview#
There were a wide variety of optimizations over various parts of the codebase, including improvements to wire format serialization, collections, query analysis, and index costing.
In summary, here are the latency numbers from Doltgres v0.56.3 to v1.0.0 compared against Postgres 15.5:
| benchmark | doltgres v0.56.3 | doltgres v1.0.0 | postgres |
|---|---|---|---|
| covering_index_scan | 6.55 | 2.48 | 18.28 |
| groupby_scan | 155.80 | 74.46 | 40.37 |
| index_join | 6.67 | 2.22 | 1.82 |
| index_join_scan | 6.21 | 1.61 | 0.69 |
| index_scan | 1235.62 | 484.44 | 183.21 |
| oltp_point_select | 0.55 | 0.37 | 0.15 |
| oltp_read_only | 11.45 | 6.55 | 2.66 |
| select_random_points | 0.97 | 0.73 | 0.22 |
| select_random_ranges | 1.20 | 1.04 | 0.42 |
| table_scan | 1235.62 | 484.44 | 183.21 |
| types_table_scan | 2778.39 | 1235.62 | 434.83 |
| oltp_delete_insert | 7.43 | 6.79 | 2.22 |
| oltp_insert | 4.10 | 3.43 | 1.10 |
| oltp_read_write | 20.00 | 13.46 | 4.41 |
| oltp_update_index | 4.10 | 3.62 | 1.14 |
| oltp_update_non_index | 3.82 | 3.30 | 1.14 |
| oltp_write_only | 8.28 | 6.91 | 1.82 |
| types_delete_insert | 7.98 | 7.17 | 2.30 |
Here’s a graph of the multipliers against Postgres:
The rest of this blog will go over every performance-related change since v0.56.3.
Wire Format Serialization Improvements#
When comparing the flamegraphs against Dolt, the code paths surrounding wire format serialization and sending packets had the largest CPU usage discrepancy.
Buffered Flush#
Perhaps the largest performance improvement we saw was with this 9 line change.
The Doltgres server needs to send result rows back the client using the Postgres protocol, which we do through the pgproto3 package.
Typically, these results are buffered and flushed out in large batches.
However, we were sending a packet for every individual row (including the initial row descriptor), wasting a ton of CPU cycles.
After adjusting the send logic to call Flush() every row_batch_size = 128, we saw drastic performance improvements practically across the board.
Benchmarks that returned multiple rows saw throughput improvements of over 200%, with some as high as 247%.
You can view the full results here.
Spooling Concurrency#
Another improvement around sending rows back to the client is one we’ve already done before in Dolt.
The server handler is in charge of reading results from RowIters, converting them into the wire format, and sending these packets to the client.
Similar to the old Dolt code, we put two goroutines in charge of these steps: one to read the rows and another to convert and send the results.
The fix here is to break these steps up into three goroutines: (1) read the rows from RowIter, (2) convert each row into wire format through SQL() method, and (3) spool results to client.
The resulting optimization gave us over 50% improvement in throughput for index_scan, table_scan, and types_table_scan; these are all benchmarks that return large result sets.
You can view the full results here.
Output Function Cache#
The serialization format functions are fully customizable by users. While this can be pretty useful, it requires additional complexity to be efficient. Namely, we should not be reloading the output function every time we serialize a field, especially since it doesn’t change within a query. So, the solution is to just cache it somewhere.
This change got us ~13% improvement in output heavy benchmarks like index_scan, table_scan, and types_table_scan.
You can view the full results here.
Wire Format Improvements#
These next optimizations all involve improving the wire format serialization itself.
Specifically, we made improvements to the TimeOfDay, bpchar, and Date types.
fmt.Sprintf() is handy but slow.
Since TimeOfDay.String() produces is a small string with a strict format and known max length, we can just create a []byte and append to it.
Additionally, we can safely use the unsafe package, to convert that []byte to a string.
func (t TimeOfDay) String() string {
	dest := make([]byte, 0, 15) // longest possible result is len("12:34:56.123456") = 15
	h, m, s, ms := t.Hour(), t.Minute(), t.Second(), t.Microsecond()
	dest = append(dest,
		'0'+byte(h/10), '0'+byte(h%10), ':',
		'0'+byte(m/10), '0'+byte(m%10), ':',
		'0'+byte(s/10), '0'+byte(s%10))
	if ms > 0 {
		dest = append(dest, '.')
		cmp := 100_000
		for cmp > 0 {
			dest = append(dest, '0'+byte(ms/cmp))
			ms %= cmp
			cmp /= 10
		}
		// trim trailing 0s
		for i := len(dest) - 1; i >= 0; i-- {
			if dest[i] != '0' {
				dest = dest[:i+1]
				break
			}
		}
	}
	return unsafe.String(unsafe.SliceData(dest), len(dest))
Next, we made an improvement to truncateString() for bpchar by again writing our own implementation.
The old implementation used the utf8 package to get the rune length and decode each rune.
func truncateString(val string, runeLimit int32) (string, int32) {
	runeLength := int32(utf8.RuneCountInString(val))
	if runeLength > runeLimit {
		startString := val
		for i := int32(0); i < runeLimit; i++ {
			_, size := utf8.DecodeRuneInString(val)
			val = val[size:]
		}
		return startString[:len(startString)-len(val)], runeLength
	}
	return val, runeLength
Here’s a Golang fun fact: len(string) returns the number of bytes, while for pos := range string returns start indexes of each rune.
Using this, we can rewrite the same logic like so:
func truncateString(val string, runeLimit int32) (string, int32) {
	var n int32
	for pos := range val {
		if n >= runeLimit {
			return val[:pos], n
		}
		n++
	}
	return val, n
This avoids iterating over the string twice and avoids extra string slicing logic.
You can view the full results here.
Doltgres allows users to change the format of the date output through session variables.
So during the wire formatting stage, we must call GetDateStyleOutputFormat(), which acquires a mutex and does a bunch of string operations.
The DATE style shouldn’t change within a query, so it makes no sense to do all these steps for each row and each DATE field.
Caching the format in the context, netted us 10%-14% improvement on the index_scan, table_scan, and types_table_scan benchmarks.
You can view the full results here.
Lastly, we made the *_scan benchmarks a faster by adjusting this single line.
-return sqltypes.MakeTrusted(sqltypes.Text, types.AppendAndSliceString(dest, value)), nil
+return sqltypes.MakeTrusted(sqltypes.Text, encodings.StringToBytes(value)), nil
This was a relic from copying over code from Dolt, where the SQL() methods are able to share a large byte buffer to reduce memory allocations.
This isn’t possible in Doltgres, so appending value to dest here is just wasting a copy operation as we can just use value directly.
As a result, index_scan, table_scan and types_table_scan saw a 8%-13% improvement.
You can view the full results here.
Collections#
Doltgres implements Collections which hold both built-in and user-defined functions, views, procedures, types, etc.
However, we were being very inefficient by loading these collections every query…sometimes multiple times!
On our first pass, we cached Collections per query, reducing the number of loads.
This gave us a decent performance bump across all the benchmarks (around 5%-12%).
Later on, we improved this further by simplifying Collections storage.
This resulted in another decent bump across the board, so around 5%-15% improvement.
You can view the full results here.
Analyzer Improvements#
The analyzer is an essential component to improving the query performance in Doltgres, and ours could use a lot of improving. Here is some of the work we did to analysis and costing that has led to better latency in Doltgres (and Dolt).
Fix Covering Indexes#
This performance optimization is actually bug fix and the first Doltgres performance improvement I made chronologically.
Dolt was missing a case for sql.ExtendedType, which Doltgres explicitly uses, so indexes weren’t getting used properly.
Afterwards, we received a nice 21.5% bump in throughput for covering_index_scan and 11.5% for select_random_ranges.
You can view the full results here.
No Index GroupBy#
After some investigation, it appears that sometimes it is better to perform a full table scan rather than lookups through a secondary index. This is because non-covering secondary indexes perform two lookups, making them expensive for filters with low selectivity. We adjusted our coster to include a full table scan option when assigning indexes and added some heuristics.
As a result, median latency on the groupby_scan benchmark saw a 43.80% improvement.
You can view the full results here.
We have previously discussed this optimization in greater detailed in this blog.
Conclusion#
For fun, here are all the latency benchmarks we have compared against Postgres:
| test | dolt | doltgres | mysql | postgres | dolt vs postgres | doltgres vs postgres | mysql vs postgres |
|---|---|---|---|---|---|---|---|
| covering_index_scan | 2.35 | 2.48 | 17.32 | 18.28 | 0.13 | 0.14 | 0.95 |
| groupby_scan | 63.32 | 74.46 | 134.90 | 40.37 | 1.57 | 1.84 | 3.34 |
| index_join | 1.93 | 2.22 | 3.43 | 1.82 | 1.06 | 1.22 | 1.88 |
| index_join_scan | 1.32 | 1.61 | 4.25 | 0.69 | 1.91 | 2.33 | 6.16 |
| index_scan | 196.89 | 484.44 | 344.08 | 183.21 | 1.07 | 2.64 | 1.88 |
| oltp_point_select | 0.25 | 0.37 | 0.19 | 0.15 | 1.67 | 2.47 | 1.27 |
| oltp_read_only | 5.00 | 6.55 | 3.62 | 2.66 | 1.88 | 2.46 | 1.36 |
| select_random_points | 0.52 | 0.73 | 0.35 | 0.22 | 2.36 | 3.32 | 1.59 |
| select_random_ranges | 0.64 | 1.04 | 0.38 | 0.42 | 1.52 | 2.48 | 0.90 |
| table_scan | 196.89 | 484.44 | 344.08 | 183.21 | 1.07 | 2.64 | 1.88 |
| types_table_scan | 442.73 | 1235.62 | 746.32 | 434.83 | 1.02 | 2.84 | 1.72 |
| oltp_delete_insert | 6.21 | 6.79 | 7.70 | 2.22 | 2.80 | 3.06 | 3.47 |
| oltp_insert | 3.13 | 3.43 | 4.03 | 1.10 | 2.85 | 3.12 | 3.66 |
| oltp_read_write | 11.24 | 13.46 | 8.90 | 4.41 | 2.55 | 3.05 | 2.02 |
| oltp_update_index | 3.30 | 3.62 | 4.33 | 1.14 | 2.89 | 3.18 | 3.80 |
| oltp_update_non_index | 3.02 | 3.30 | 4.10 | 1.14 | 2.65 | 2.89 | 3.60 |
| oltp_write_only | 6.21 | 6.91 | 5.18 | 1.82 | 3.41 | 3.80 | 2.85 |
| types_delete_insert | 6.79 | 7.17 | 8.28 | 2.30 | 2.95 | 3.12 | 3.60 |
| avg_mult | 1.92 | 2.59 | 2.55 |
Using some old tricks and writing some new ones, we’ve trimmed a lot of fat from Doltgres; in fact, we’re about as lean as MySQL (which is apparently not that lean standing next to Postgres).
We are still 2.6x slower than Postgres, so we have a long ways to go.
Dolt stands at 1.92x, so the theoretical best Doltgres can do (as far as we know) is under 2x.
Feel free to chat with us on Discord or file a Github issue.