
To run a production database reliably, you need to be able to monitor its health and performance. Dolt publishes metrics about its operation via a Prometheus endpoint. The metrics include information about concurrent connections, query performance, cpu, memory and disk usage, and more. Historically, these metrics were only available if you self-hosted Dolt, but we are excited to announce that Hosted Dolt instances now publish metrics that you can monitor and alert on.
Accessing Hosted Dolt Metrics#
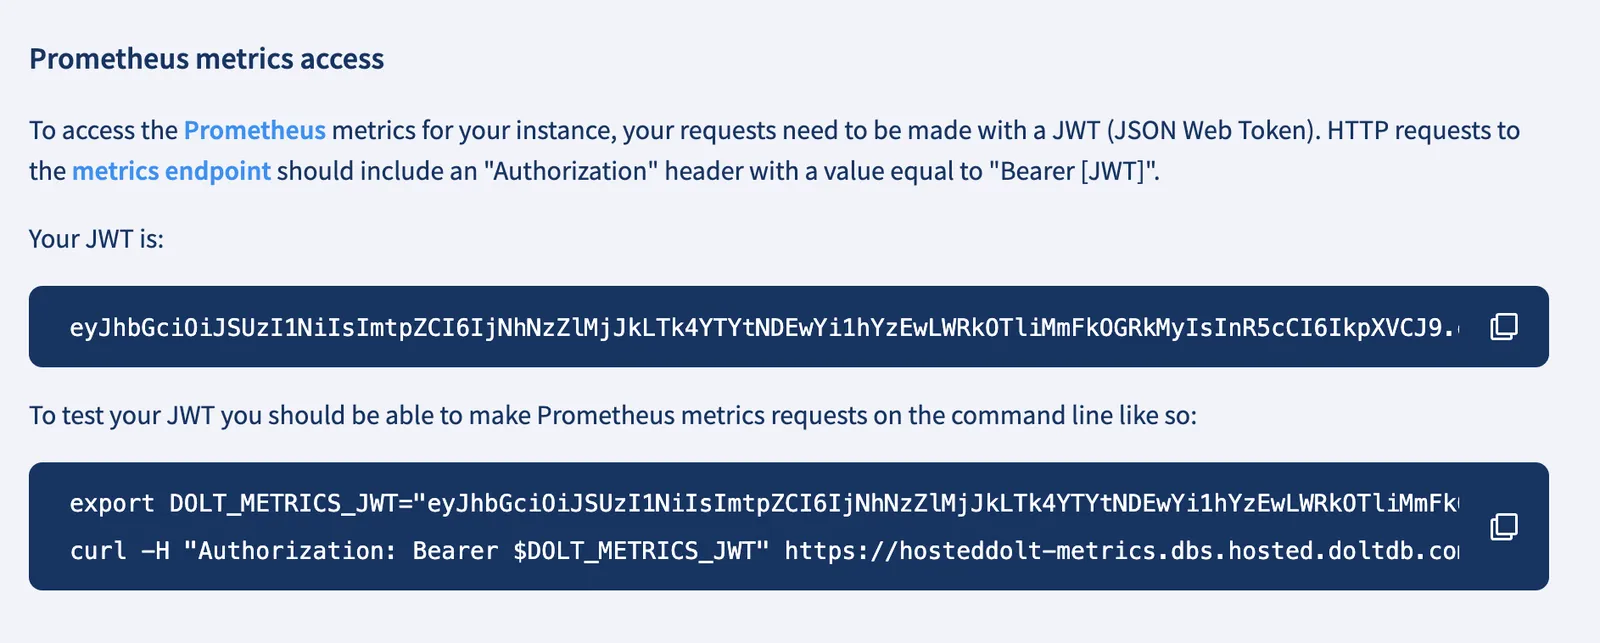
On the settings tab for your Hosted Dolt deployment, you will find a new section called “Prometheus metrics access.” In this
section, you can download a token that can be used in requests to the Prometheus metrics endpoint, and there is also an example
curl command that shows how to use the token to access the metrics.
Copying the curl command and running it in my bash terminal I see the following output:
>curl -H "Authorization: Bearer $DOLT_METRICS_JWT" https://hosteddolt-metrics.dbs.hosted.doltdb.com:8888/metrics
# HELP dss_concurrent_connections Number of clients concurrently connected to this instance of dolt sql server
# TYPE dss_concurrent_connections gauge
dss_concurrent_connections{process="dolt_sql_server"} 1
# HELP dss_concurrent_queries Number of queries concurrently being run on this instance of dolt sql server
# TYPE dss_concurrent_queries gauge
dss_concurrent_queries{process="dolt_sql_server"} 0
# HELP dss_connects Count of server connects
# TYPE dss_connects counter
dss_connects{process="dolt_sql_server"} 11273
# HELP dss_disconnects Count of server disconnects
# TYPE dss_disconnects counter
dss_disconnects{process="dolt_sql_server"} 11272
# HELP dss_dolt_version The version of dolt currently running on the machine
# TYPE dss_dolt_version gauge
dss_dolt_version{process="dolt_sql_server"} 2.2020098e+07
# HELP dss_query_duration Histogram of dolt sql server query runtimes
# TYPE dss_query_duration histogram
dss_query_duration_bucket{process="dolt_sql_server",le="0.01"} 11119
dss_query_duration_bucket{process="dolt_sql_server",le="0.1"} 11119
dss_query_duration_bucket{process="dolt_sql_server",le="1"} 11122
dss_query_duration_bucket{process="dolt_sql_server",le="10"} 11122
dss_query_duration_bucket{process="dolt_sql_server",le="100"} 11122
dss_query_duration_bucket{process="dolt_sql_server",le="1000"} 11122
dss_query_duration_bucket{process="dolt_sql_server",le="+Inf"} 11122
dss_query_duration_sum{process="dolt_sql_server"} 5.027077647000007
dss_query_duration_count{process="dolt_sql_server"} 11122

...
The endpoint is publishing metrics in prometheus format that can be scraped and ingested into your monitoring system of choice.
What Metrics are Available#
The metrics published by Dolt were covered in detail is this blog post. In addition to those metrics, Dolt began publishing cpu, memory, and disk usage stats in version 1.80.2.
# HELP sys_cpu_usage The percentage of CPU used by the system
# TYPE sys_cpu_usage gauge
sys_cpu_usage{process="dolt_sql_server"} 0.6048387092917595
# HELP sys_disk_usage The percentage of disk used by the system
# TYPE sys_disk_usage gauge
sys_disk_usage{process="dolt_sql_server"} 8.918423411096613
# HELP sys_mem_usage The percentage of memory used by the system
# TYPE sys_mem_usage gauge
sys_mem_usage{process="dolt_sql_server"} 14.201225972075635
An Example Integration#
Our blog Prometheus Works with Dolt goes through
how to integrate Dolt metrics with Prometheus and Grafana. You can follow the same steps to
integrate Hosted Dolt metrics into your prometheus scraper with two small additions to your configuration. First, you will
need to set the protocol to https. This is done by adding the line scheme: https to the yaml config file used
to configure the scraper. Next, you need to add the Authorization header with the bearer token you downloaded from the
Hosted Dolt dashboard. This can be done by adding either the bearer_token key with a value equal to the string representation
of the JWT to your configuration. Alternatively the string representation of the JWT can be saved in a file and the bearer_token_file
key would be added to your configuration. Here is an example job which could be added to your Prometheus config file to scrape metrics from a Hosted Dolt instance:
  - job_name: 'dolt'
    scrape_interval: 5s

    scheme: https

    bearer_token: 'eyJhbGciOiJSUzI1NiIsImtpZCI6IjNhNzZlMjJkLTk4YTYtNDEwYi1hYzEwLWRkOTliMmFkOGRkMyIsInR5cCI6IkpXVCJ9.eyJhdWQiOlsiZGVwbG95bWVudE93bmVycy9kb2x0aHViL2RlcGxveW1lbnRzL3F1aWNrLXRlc3QiXSwiZXhwIjoxODAwNDkyNTY5LCJpYXQiOjE3Njg5NTY1NjksImlzcyI6Imhvc3RlZGRvbHRkYi5ob3N0ZWRkZXYubGQtY29ycC5jb20iLCJqdGkiOiJkOGYyOGU5MS0zNmVmLTQzYWYtODUyMy03NmRlOGM2N2M4NDUiLCJvbl9iZWhhbGZfb2YiOiJiaGVuaSIsInN1YiI6Im1ldHJpY3MtcmVhZGVyIn0.UvM4IUZ1hkmA9MXR3JPZ5JEzPVvG-xemwhQv6E1G3XBGN4_SpyrI8skuwjtqpTevBC5Fx1JGwHVvR0zOkhLEqT1RA_QoX1PisNhcO1GMJYnVkJO-Wrhtq_783pyhiEp05eO48q_X08OvlbxFOBFSY08VLyH71IiiWWOHs_-UwbF0gvgSwseTqzW4V2GlKg4FK16Sz6A_2CQRX9w2RvkYov71cJkJoG-3IzY2Lk40krJd5fk4jg2GZlfk3vmZqkcZ45eFkxxxpwxARBsEuf3mIlMHWjfpTXOnGgoZhw_o9JKoXeaYsjz6oCw4YmtJa2Ky9up_AO5bTpMNgF3oQcXakw'

    static_configs:
      - targets: ['hosteddolt-metrics.dbs.hosted.doltdb.com:8888']
or
  - job_name: 'dolt'
    scrape_interval: 5s

    scheme: https

    bearer_token_file: '/path/to/dolt-metrics-jwt.txt'

    static_configs:
      - targets: ['hosteddolt-metrics.dbs.hosted.doltdb.com:8888']
What’s the Point? Hosted Dolt Already has a Metrics Dashboard.#
While Hosted Dolt does provide a metrics dashboard for each deployment, it does not allow you to set up alerts or integrate with your existing monitoring systems. By providing access to the Prometheus metrics endpoint, you can now integrate Hosted Dolt metrics into your existing monitoring and alerting systems. This should give better operational confidence in your Hosted Dolt deployments, and allow you to see how changes to your application correlate with changes in database performance.
Conclusion#
Here at DoltHub our customers and their needs are our highest priority. The ability to integrate Hosted Dolt metrics into our customers’ existing monitoring systems is a feature that has been requested from several customers, and we are excited to deliver it. We look forward to hearing from you about how you about how we could improve this feature. If there are specific metrics you would like to see added, or if you have any other feedback, please reach out to us on Discord.