
Last year, we announced that Dolt reached Sysbench performance parity with MySQL on read and write benchmarks, and followed up with a breakdown of the specific performance optimizations. As promised, we continue to bring more performance optimizations to Dolt. Today, we’re proud to announce that we’ve hit parity with MySQL on Sysbench read benchmarks!
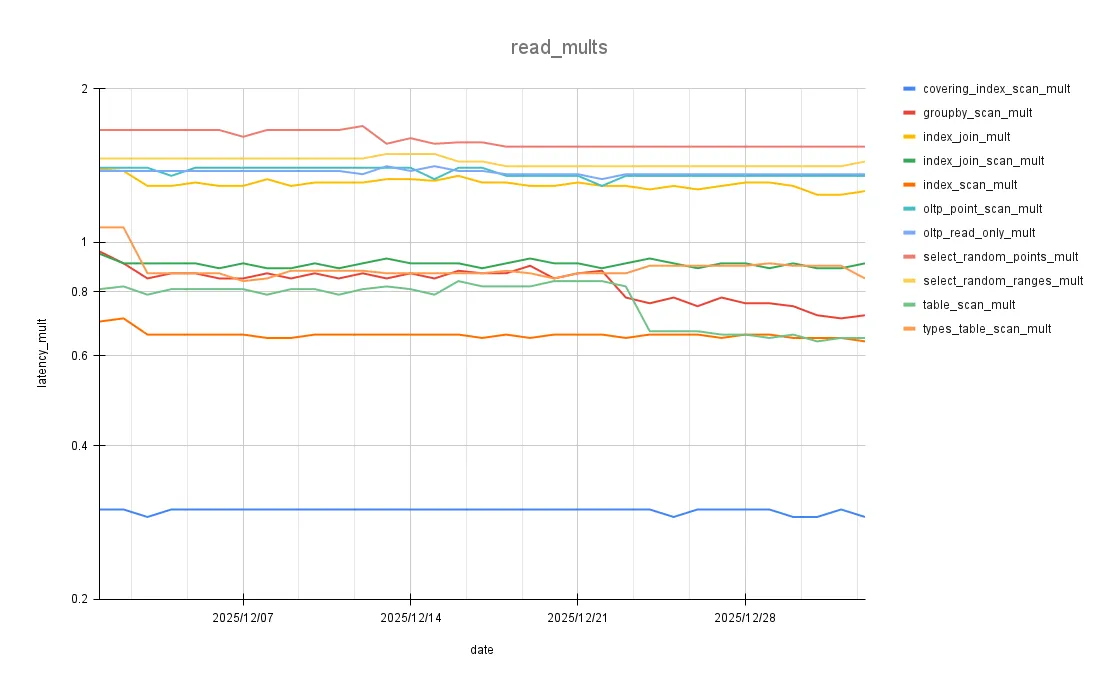
Here’s a graph of Sysbench read benchmark improvements over the last month:
Fast Path for IN Filters#
This optimization was highlighted as a sneak peek in the previous blog.
When converting filters to indexes, we create a RangeTree that sorts and removes overlaps between any two ranges.
This works great for arbitrary filters, but we may be doing unnecessary work for simpler filters of a specific form.
The benchmark select_random_points filters a table with a randomly generated IN query, resulting in a query highly selective and non-contiguous.
Rather than building an entire RangeTree, we can just sort and de-duplicate these point-select queries.
Relevant Benchmarks:
| benchmark | from_latency | to_latency | percent_change |
|---|---|---|---|
| oltp_point_select | 0.28 | 0.27 | -3.57 |
| select_random_points | 0.58 | 0.55 | -5.17 |
Avoid Heap Allocations in transform.Inspect and transform.InspectExpr#
During the analysis process, certain rules traverse sql.Node and sql.Expression trees looking for specific nodes or expressions without altering the structure of the trees.
This is mainly done through the transform.Inspect() and transform.InspectExpr() functions.
Previously, the inspect functions would be recursively called on the result of node.Children().
func InspectExpr(expr sql.Expression, f func(sql.Expression) bool) bool {
	children := expr.Children()
	for _, child := range children {
		if InspectExpr(child, f) {
			return true
		}
    }
    if f(expr) {
        return true
    }
    return false
}
Since the return type of expr.Children() is []sql.Expression, the node/expressions here would escape to the heap.
Fortunately, most nodes have either 1 or 2 children, so we use a type switch for UnaryNode and BinaryNode to recursively call Inspect on the children directly.
func InspectExpr(expr sql.Expression, f func(sql.Expression) bool) (stop bool) {
	// Avoid allocating []sql.Expression
	switch e := expr.(type) {
	case expression.UnaryExpression:
		if InspectExpr(e.UnaryChild(), f) {
			return true
		}
	case expression.BinaryExpression:
		if InspectExpr(e.Left(), f) {
			return true
		}
		if InspectExpr(e.Right(), f) {
			return true
		}
	default:
		children := e.Children()
		for _, child := range children {
			if InspectExpr(child, f) {
				return true
			}
		}
	}
	if f(expr) {
		return true
	}
	return false
}
Relevant Benchmarks:
| benchmark | from_latency | to_latency | percent_change |
|---|---|---|---|
| oltp_point_select | 0.28 | 0.27 | -3.57 |
| oltp_read_only | 5.28 | 5.18 | -1.89 |
| select_random_points | 0.55 | 0.54 | -1.82 |
| select_random_ranges | 0.56 | 0.55 | -1.79 |
| table_scan | 28.67 | 28.16 | -1.78 |
PlanBuilder convertInt() Improvements#
During plan-building, we convert integers into the smallest integer type that can hold the value.
For example, 300 would go into a int16 as 300 is too large for an int8 and uint8.
We used to do this by calling strconv.ParseInt and strconv.ParseUint with increasing bitSize arguments until we got a result that didn’t error.
It’s much quicker to parse once with a bitSize of 64, and use bit-masking to convert the result into the appropriate integer.
Relevant Benchmarks:
| benchmark | from_latency | to_latency | percent_change |
|---|---|---|---|
| groupby_scan | 12.08 | 11.87 | -1.74 |
| index_join | 2.03 | 1.96 | -3.45 |
| select_random_points | 0.56 | 0.55 | -1.79 |
| select_random_ranges | 0.58 | 0.57 | -1.72 |
| table_scan | 28.16 | 27.66 | -1.78 |
Concurrent GroupBy#
The groupByGroupIter iterates over the childIter, calculates a grouping key, and updates the aggregation buffer.
We can take advantage of concurrency here: one thread for reading off the childIter, another to calculate the groupingKey and update the aggregation buffer.
Relevant Benchmarks:
| benchmark | from_latency | to_latency | percent_change |
|---|---|---|---|
| groupby_scan | 12.08 | 10.84 | -10.26 |
Avoid Map in GetFieldValue#
As part of the move from sql.Row to sql.ValueRow change, we need to map the type encodings on disk to the wire format type encodings.
In an attempt to simplify the case statements, we did this through a golang map.
It turns out map access is not as free as we thought, and the frequent lookups added some significant overhead to GetFieldValue().
So removing the map and assigning the mapped types yielded a nice performance boost, specifically on benchmarks that involved returning a large number of rows.
Relevant Benchmarks:
| benchmark | from_latency | to_latency | percent_change |
|---|---|---|---|
| covering_index_scan | 0.55 | 0.54 | -1.82 |
| groupby_scan | 10.65 | 10.46 | -1.78 |
| index_join | 1.96 | 1.93 | -1.53 |
| table_scan | 28.16 | 23.1 | -17.97 |
| types_table_scan | 65.65 | 68.05 | 3.66 |
There is a small performance hit to types_table_scan due to the increased number of branches in the switch statement, but it’s worth it.
Custom Date Parsing Improvement#
As part of the previous blog, we switched away from the time.Time implementation of AppendDate for our own.
While that gave us a nice bump in queries involving any DATE and DATETIME types, we noticed we could do a little better.
The previous implementation made separate calls to time.Year(), time.Month(), time.Day(), etc., which includes some repeated work.
Switching to year, month, day = time.Date() and hours, mins, secs = time.Clock() shaved off some time.
Relevant Benchmarks:
| benchmark | from_latency | to_latency | percent_change |
|---|---|---|---|
| index_join_scan | 1.37 | 1.34 | -2.19 |
| index_scan | 22.69 | 22.28 | -1.81 |
| table_scan | 23.1 | 22.69 | -1.77 |
| types_table_scan | 68.05 | 66.84 | -1.7 |
Pointer TupleComparator#
The DefaultTupleComparator implementation includes a fast member variable which was defined as [][2]ByteSize.
This stored the starting and ending indices for fields to quickly compare Tuple prefixes.
Since this is used to compare prefixes, the indexes always start at 0 and are always sequential, so we only need to track the ending index.
Relevant Benchmarks:
| benchmark | from_latency | to_latency | percent_change |
|---|---|---|---|
| groupby_scan | 10.46 | 9.91 | -5.26 |
| index_join | 1.96 | 1.89 | -3.57 |
Conclusion#
Altogether, these changes brought our mean read latency multiplier down from 1.05 to 1.00.
Our overall read and write multiplier is now 0.96, meaning Dolt actually outperforms MySQL on these benchmarks.
Of course, improvements can always be made, so we will continue to improve Dolt’s performance.
Try out Dolt yourself, and feel free to file any performance issues.
If you just want to chat, feel free to join our Discord.