
Dolt is the world’s first version-controlled relational database. Think MySQL and Git had a baby. Dolt lets you branch, fork, clone, merge, and diff your relational data. We’ve been hard at work optimizing Dolt to improve our sysbench numbers, when we discovered something interesting in our performance profiles.
Profiling on MacOS#
Dolt is written in Golang, which allows us to use Go pprof.
This is a handy tool that profiles Go programs, highlighting sources of slowness and bottlenecks.
We have various benchmarks for various queries, but let’s focus on select_random_points, which benchmarks
SELECT
    id, k, c, pad
FROM
    sbtest1
WHERE
    k IN (k1, k2, ..., k10)
where k1, k2, ... is a list of 10 random ints.
This benchmark specifically targets our ability to utilize indexes to traverse parts of the B-Tree (Prolly Tree in our case) and return a singular row.
I do my development on an M4 Mac, and this is the resulting flame graph from the pprof:
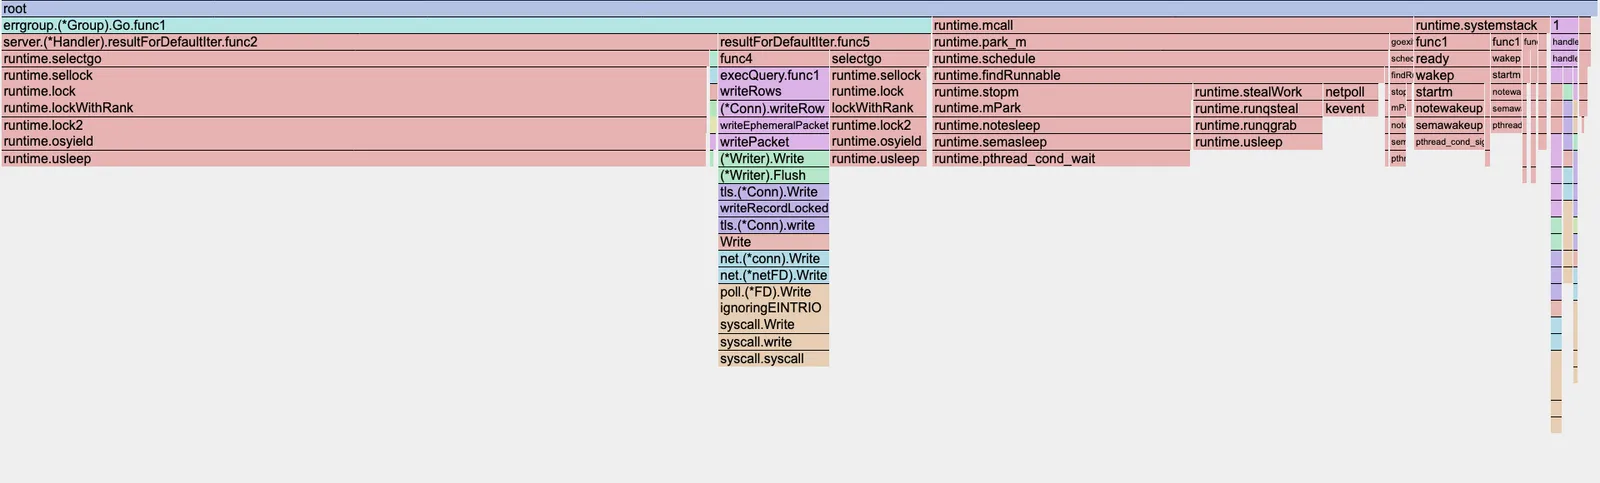
This indicates that a large portion of our CPU time is consumed by runtime.usleep, namely in the goroutines resultForDefaultIter.func2 and resultForDefaultIter.func5.
These are the goroutines that are in charge of reading the rows off disk and sending them the client.
Looking at the top output further confirms this.
(pprof) top
Showing nodes accounting for 43.56s, 98.33% of 44.30s total
Dropped 273 nodes (cum <= 0.22s)
Showing top 10 nodes out of 74
      flat  flat%   sum%        cum   cum%
    26.25s 59.26% 59.26%     26.25s 59.26%  runtime.usleep
     7.69s 17.36% 76.61%      7.69s 17.36%  runtime.pthread_cond_wait
     3.87s  8.74% 85.35%      3.87s  8.74%  syscall.syscall
     3.39s  7.65% 93.00%      3.39s  7.65%  runtime.pthread_cond_signal
     1.83s  4.13% 97.13%      1.83s  4.13%  runtime.kevent
     0.42s  0.95% 98.08%      0.42s  0.95%  runtime.pthread_kill
     0.08s  0.18% 98.26%      0.34s  0.77%  runtime.scanobject
     0.01s 0.023% 98.28%     19.89s 44.90%  github.com/dolthub/go-mysql-server/server.(*Handler).resultForDefaultIter.func2
     0.01s 0.023% 98.31%     13.25s 29.91%  runtime.findRunnable
     0.01s 0.023% 98.33%      3.67s  8.28%  runtime.stealWork
The profile here seems to imply that these goroutines spend a ton of time waiting around. I reported my findings my coworker, and in the wise words of Aaron Son, “This don’t make no sense!”
Profiling on Ubuntu#
Aaron performed the exact same benchmarks, but on an Ubuntu instance.
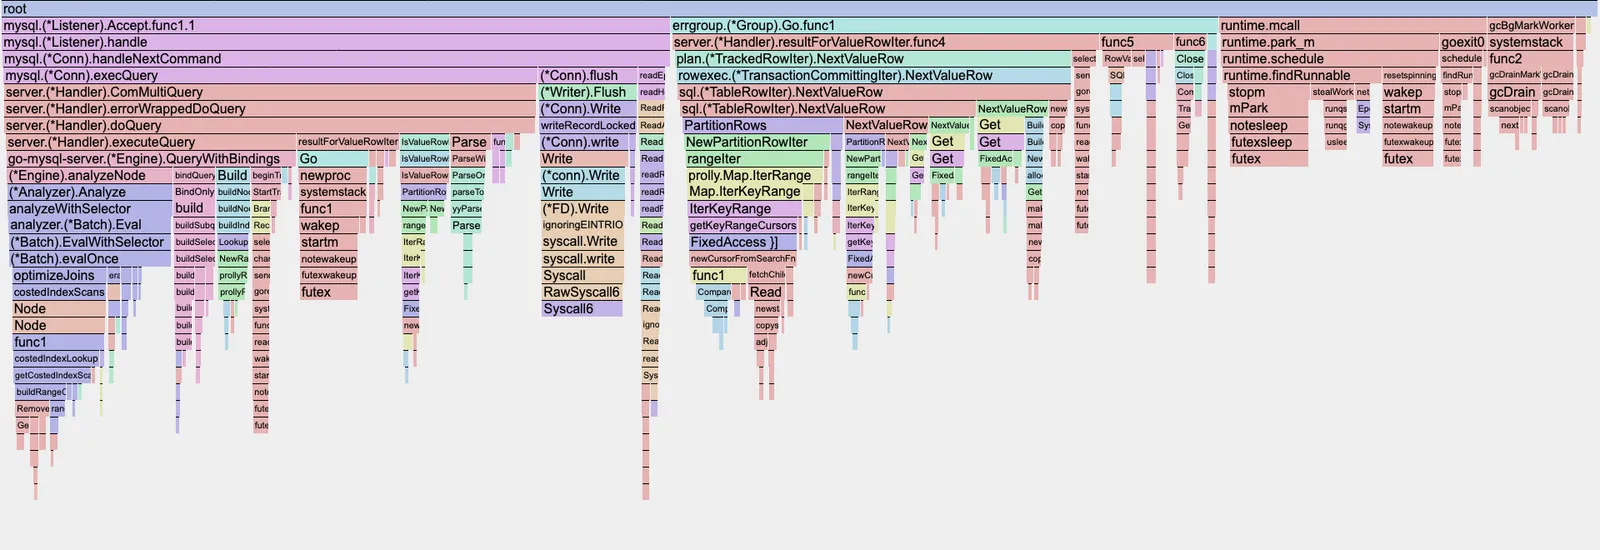
Surprisingly, the resulting flame graph is pretty different, but it is displaying something much more sensible. The large blocks consist of functions that are written by us rather than underlying go runtime functions.
Peeking at the top output,
(pprof) top
Showing nodes accounting for 53.06s, 36.85% of 143.98s total
Dropped 1531 nodes (cum <= 0.72s)
Showing top 10 nodes out of 280
      flat  flat%   sum%        cum   cum%
    24.81s 17.23% 17.23%     24.81s 17.23%  runtime.futex
     9.34s  6.49% 23.72%      9.34s  6.49%  internal/runtime/syscall.Syscall6
     4.99s  3.47% 27.18%      4.99s  3.47%  runtime.duffcopy
     2.49s  1.73% 28.91%      2.49s  1.73%  runtime.nextFreeFast
     2.20s  1.53% 30.44%      2.20s  1.53%  runtime.usleep
     1.91s  1.33% 31.77%      1.91s  1.33%  runtime.memclrNoHeapPointers
     1.90s  1.32% 33.09%      6.46s  4.49%  runtime.scanobject
     1.86s  1.29% 34.38%      2.45s  1.70%  runtime.typePointers.next
     1.82s  1.26% 35.64%      7.62s  5.29%  github.com/dolthub/dolt/go/store/val.TupleDesc.Compare
     1.74s  1.21% 36.85%      4.89s  3.40%  github.com/dolthub/dolt/go/store/val.DefaultTupleComparator.Compare
Besides futex and syscall, what stands out here is actually runtime.duffcopy.
This is the go runtime responsible for copying large chunks of memory around.
After doing some digging, it turns out during Prolly Tree traversal (and other functions) we pass around val.TupleDesc and tree.Node by value.
Since these two structs are relatively large, passing them around results in many unnecessary and costly copies.
Fix#
Fortunately, the fix was just prepending this * to val.TupleDesc and tree.Node.
Some notable improvements:
groupby_scan:18.61 -> 14.73; -20.85%index_join:2.57 -> 2.14; -16.73%select_random_points:0.64 -> 0.61; -4.69%
The full benchmarks can be found:
- https://github.com/dolthub/dolt/pull/10025#issuecomment-3487995157
- https://github.com/dolthub/dolt/pull/10029#issuecomment-3493529537
Evidently, removing these deep copies resulted in a nice performance boost.
Revisiting MacOS#
Did these bottlenecks show up in the MacOS profile?
Filtering for runtime.duffcopy on the MacOS profile, we get:
Active filters:
   focus=duffcopy
Showing nodes accounting for 0.09s, 0.2% of 44.30s total
Showing top 10 nodes out of 15
      flat  flat%   sum%        cum   cum%
     0.09s   0.2%   0.2%      0.09s   0.2%  runtime.duffcopy
         0     0%   0.2%      0.08s  0.18%  github.com/dolthub/dolt/go/libraries/doltcore/sqle/index.prollyIndexIter.Next
         0     0%   0.2%      0.03s 0.068%  github.com/dolthub/dolt/go/libraries/doltcore/sqle/index.prollyIndexIter.Next.func1
         0     0%   0.2%      0.03s 0.068%  github.com/dolthub/dolt/go/libraries/doltcore/sqle/index.prollyIndexIter.rowFromTuples
Had we only relied on the MacOS profile, it is highly unlikely we would have noticed this relatively simple fix.
Surely, we can’t be the first or only ones to have encountered this issue? Gemini certainly thinks something is up.

Doing some more digging, I stumbled across this closed GitHub Issue. Then, I found this active GitHub issue created back in 2023. Users in these threads are also seeing a large discrepancy in their graphs compared to what they expected. It appears that this is not a problem with Golang, but rather a long-standing issue associated with MacOS. Specifically, there seems to be bias in Mac’s reporting of POSIX signals, overly attributing cpu time to syscalls and random threads. So, PSA to any Golang MacOS developers: don’t trust your cpu pprof, especially if you have concurrency.
Conclusion#
Moving forward, we’ll just workaround the issue by profiling on Ubuntu.
Here at DoltHub, we are consistently working on improving Dolt in terms of compatibility, correctness, and performance. Over the years, Dolt has seen large performance improvements; starting from somewhere in 8-70x slower, to 2-4x slower, to now 1-1.1x slower compared to MySQL. Try out Dolt yourself, and feel free to file any performance issues. If you just want to chat, feel free to join our Discord.