
I’m staring down 400M rows of hospital prices that, to my knowledge, haven’t been seen before by the public. At least not all in one place, and definitely not by someone like me, who’s more used to avoiding medical bills than trying to make sense of them.
The open hospital price database got quite a bit of positive attention lately as it surpassed 500+ hospitals, making it competitive with similar databases that can cost tens of thousands of dollars a year to access. The data is sourced from paid volunteers, but the quality is high, as far as the codes and rates go.
This database makes many things that used to be impossible, technically possible. Kind of like how foglamps make driving in fog technically possible, but still dangerous if you’re not careful.
I want to show you how to work with this data starting from zero. As an example, we’ll fire up DuckDB, Python, and Pandas and look at which insurance companies are getting a bad deal. The rest of the analysis is up to you. This is foggy, uncharted territory.
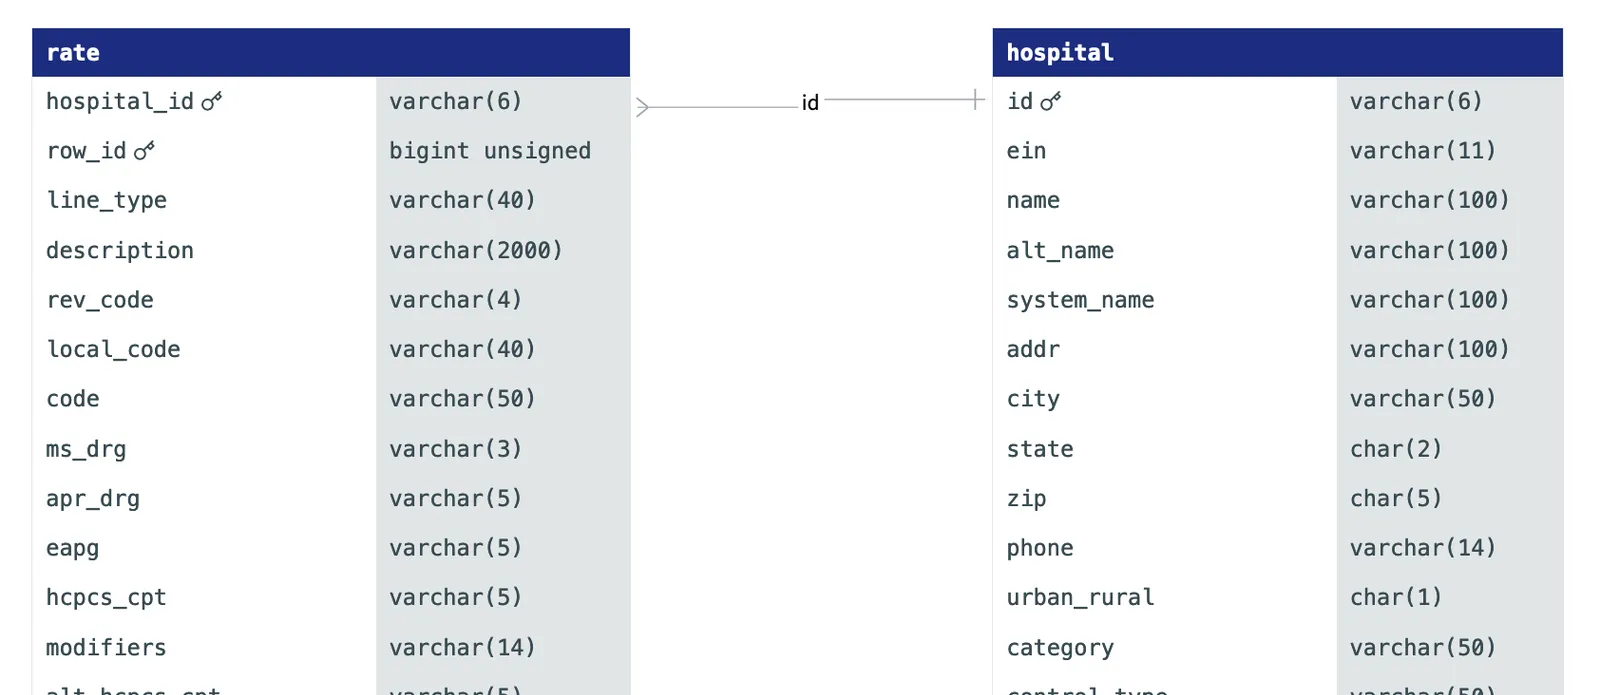 A snippet of our table’s ER diagram
Data sample#
Here’s a few sample rows and columns from the open hospital price database. Volunteers have already correctly extracted the billing codes. The only wrinkle in the database is that the payer_names remain in the forms that the hospitals provided them:
| hospital_id | description | hcpcs_cpt | ms_drg | rev_code | standard_charge | payer_name | payer_category |
|---|---|---|---|---|---|---|---|
| 010011 | Upper Limb And Toe Amputation For Circulatory System Disorders With MCC | 255 | 14991.21 | i150180_VIVA_MEDICARE_ME_CAP_2798 | payer | ||
| 010011 | Other Hepatobiliary Or Pancreas O.R. Procedures Without CC/MCC | 425 | 13497.70 | i450403_UNITED_BEHAVIORAL_HEALTH_2727 | payer | ||
| 010011 | Peritoneal Adhesiolysis With MCC | 335 | 22934.26 | i150186_MEDICARE_VIVA_OPEN_ACCESS_2798 | payer | ||
| 050777 | CATHETER URETERAL ($15000.01-20000) | C1758 | 0272 | 21875.00 | COMMERCIAL OUTPATIENT - KAISER FOUNDATION HEALTH PLAN, INC. PRICE | payer | |
| 310048 | Mesh Surgical Prolene 6X3In Knit Nonabsorbable 2 Direction… | C1781 | 718.59 | Discounted Cash Price * (See Below) | cash | ||
| 050723 | CATHETER .035IN 8FR 18-19-20MM 240CM 5.5CM 3 STAGE 2 RADIO… | C1726 | 476.00 | De-identified Maximum Negotiated $ | max | ||
| 220017 | RL TISSUE CULTURE; LYMPHOCYTE | 88230 | 0311 | 173.21 | Tufts Select | payer | |
| 220098 | ADMIN FLU VIRUS VACCINE | 90471 | 0771 | 35.39 | Medicaid Managed - Miscellaneous | payer |
The hospital_id is linked to hospital.id, with all the hospital information (including the source of the data files.)
In this table, a cross section of the data, we can see a few things:
- two kinds of billing codes: MS-DRG (always inpatient) and HCPCS/CPT (always outpatient). The full dataset contains MS-DRGs, APR-DRGS, HCPCS/CPT (and Alternate HCPCS/CPTs with modifiers), APCs, ICDs, and detailed contracting information (if provided)
- the payer strings contain contracting information (read “VIVA MEDICARE CAP” as “capitation Medicare contract from Viva Health”)
- we have a
payer_categoryfield, which labels whether the rate is a negotiated rate (“payer”), list price (“gross”), cash price, or min/max price
But first, how#
Building the open hospital price database took us a number of tries to get right. Since volunteers do the data transformation by hand, we make it as easy as we can for them to make pull requests (DoltHub takes data as pull requests the same way GitHub takes code as pull requests). Dolt made this project possible: we wouldn’t have been able to ensure data quality without clones, forks, branches and pull requests.
I believe we have the most accurate data out there, as far as the raw data goes.
We settled on having One Big Table for our rates, instead of breaking them out into multiple tables. We keep the original and transformed data side by side, as in:
| code | hcpcs_cpt | modifiers |
|---|---|---|
| HCPCS 73070-26 | 73070 | 26 |
with the untransformed data in the first column and the transformed data in the second and third columns. We can look at the data and confirm that any transformations match the source. On top of that, we can potentially use them for ML training (as labels) later on.
Getting the data#
Put this into your shell to install dolt and get the data. You don’t need an account.
sudo curl -L https://github.com/dolthub/dolt/releases/latest/download/install.sh | sudo bash
dolt clone dolthub/transparency-in-pricing
cd transparency-in-pricing
dolt table export rate rate.parquet
dolt table export hospital hospital.parquet
It will take around ~15min to download and, if you want to export to Apache Parquet for analysis, around 2h to do that. If you just want the Dolt database, you can comment out the last two lines, but at 330M+ rows of data, you’ll probably want to use some kind of OLAP tool for analysis, like DuckDB. For complex queries on data this large, any OLTP database, including Dolt, will struggle.
The data tells a story — but you have to know where to look#
Simple analyses won’t tell you much. It would be nice if you could just do
SELECT * FROM rate ORDER BY standard_charge DESC LIMIT 1but this assumes you can directly compare prices between hospitals. You can’t, at least not always.
Every time you visit a hospital, you typically rack up charges from all directions. The hospital might charge you for a few X-rays, some anesthesia, an ibuprofen, a gatorade, and a surgery, while a doctor might bill you separately just to look at the X-ray the hospital took.
The rates (or standard_charges) in the database are what insurance companies (payer_name) have agreed to pay for each item on your bill, assuming that’s all you get billed for. But this is rarely the case for outpatient stays. With several items on your bill, some might be discounted, while others get zeroed out entirely.
To summarize: for a typical outpatient stay, you can’t know in advance what you’ll be charged for, nor what there charges would add up to if you could. And that’s just to get the amount the insurance company pays, before you factor in copays and all that. You probably can’t use this data on its own — or any insurance contracting data — to estimate your bill, or anyone else’s.
Let’s focus at what we can estimate: how much insurance companies pay for the inpatient stays.
One hell of a DRG#
Because inpatients tend to accumulate lots of charges, like room stays, surgery bills, food, time, etc., they tend to be expensive. Without some way to keep costs down, hospitals would squeeze you dry as they sponged you down. So the government came up with a nifty idea: for inpatient stays, the hospital can bill Medicare with just one code to cover everything. This way, hospitals don’t have any incentive to tack on additional charges for stuff that no one needs.
All inpatient hospitals use this system.
Because DRGs are both comprehensive, and for inpatient stays, they tend to be extremely expensive. Let’s look at some rates from our table:
D SELECT hospital_id, description, ms_drg, standard_charge, payer_name, payer_category
FROM rate.parquet
WHERE ms_drg
IS NOT NULL USING SAMPLE 500;| hospital_id | description | ms_drg | standard_charge | payer_name | payer_category |
|---|---|---|---|---|---|
| 390211 | KIDNEY AND URETER PROCEDURES FOR NEOPLASM WITH MCC | 656 | 28815.61 | Anthem Blue Access | payer |
| 350002 | INFECTIOUS AND PARASITIC DISEASES WITH O.R. PROCEDURES WITH CC | 854 | 22523.00 | Sanford Health Plan | payer |
| 232034 | Major Esophageal Disorders Without CC/MCC | 370 | 5432.50 | i97C_UNITED_HLT_COMMUNITY_DUAL_3025 | payer |
| 100361 | Biliary Tract Procedures Except Only Cholecystectomy With Or Without C.D.E. With… | 408 | 22409.04 | Medicare_Replacement_6164_MEDICARE_PPO_MISCELLANEOUS_773 | payer |
| 450697 | BACK & NECK PROC EXC SPINAL FUSION W/O CC/MCC | 491 | 10811.45 | CARESACT | payer |
| 390091 | Major small & large bowel procedures w MCC | 329 | 83494.88 | IP Price | gross |
Even though all the rates are for different procedures, it’s fitting that the highest rate is a sticker price (or “gross”) as opposed to a payer-negotiated (or “payer”) rate. This is a trend you’ll see often.
With DRGs, it’s not as hard to compare rates from hospital to hospital, because each DRG represents the same group of services, more or less. Looking at the second row from the top of this table, if you were treated for “INFECTIOUS AND PARASITIC DISEASES WITH O.R. PROCEDURES WITH CC” (DRG 854) at CHI Saint Alexius Health Bismarck, then Sanford Health Plan is paying your hospital around $23,000, full stop. Because of this simplicity in how rates get charged for inpatient services, we have a prayer for doing some kind of analysis.
The start of an analysis project#
I think it’s natural to want to do some analysis and find out which insurance companies (or employee sponsored health plans), if any, are paying out the ears for stuff.
Here’s how I loaded the data into memory:
import duckdb
import polars as pl
import pandas as pd

con = duckdb.connect()

query = '''
    SELECT DISTINCT h.id, payer_name, plan_name, ms_drg, standard_charge
    FROM read_parquet('../rate.parquet') as r
    JOIN read_parquet('../hospital.parquet') as h
    ON h.id = r.hospital_id
    WHERE r.payer_category = 'payer'
    AND ms_drg IS NOT NULL
    AND standard_charge IS NOT NULL
'''

result = con.execute(query)

rate_pandas = (
	result
	.fetch_df()
	.drop_duplicates()
	.sample(1_000_000)
)
Once I’m here, I immediately switch to polars and shrink the dataframe down to just a sample (1M rows.) There are only around 1000 MS-DRG codes, so this should give us a decent sample of each one:
rate = (
    pl.from_pandas(rate_pandas)
    .unique()
    .sample(1_000_000)
)
The approach is: find the mean and standard deviation of the rate of any DRG at any hospital. Then find how much each insurance company is paying above or below that mean rate, on average. We’ll use a parameter “z” to describe how much above or below the mean a rate is. If it’s one standard deviation above the mean, z=1, and so on.
source = (
    pl.from_pandas(rate_pandas)
    .with_columns(pl.col('standard_charge').cast(float))

    # filter out DRGs below $100
    .filter(pl.col('standard_charge') > 100)

    # get the things we'll need to compute the z-score
    .with_columns([
        pl.col('standard_charge').mean().over(['ms_drg', 'id']).alias('mean'),
        pl.col('standard_charge').std().over(['ms_drg', 'id']).alias('std'),
        pl.col('standard_charge').count().over(['ms_drg', 'id']).alias('count')
    ])

    # we'll limit our group size to 15: any time there are fewer rates than this
    # we won't trust the statistics
    .filter(pl.col('count') > 15)

    # compute the z-score
    .with_columns(
        ((pl.col('standard_charge') - pl.col('mean'))/pl.col('std')).alias('z_score')
    )

    .sort('z_score')
)
At the most extreme end of low-Z, we should see an insurance company paying an oddly low price compared to the others, for the same procedure. Here’s one that we see:
(
    source
    .filter(pl.col('id') == source[0]['id'][0])
    .filter(pl.col('ms_drg') == source[0]['ms_drg'][0])
    .select([
        'id',
        'ms_drg',
        'description',
        'payer_name',
        'standard_charge',
    ])
)| id | ms_drg | description | payer_name | standard_charge |
|---|---|---|---|---|
| 140094 | 887 | Other Mental Disorder Diagnoses | i103007501_IMAGINE_HEALTH_PPO_1824 | 1236.00 |
| 140094 | 887 | Other Mental Disorder Diagnoses | i103002511_PRESENCE_SMEHP_HUMANA_HMO_1817 | 10121.44 |
| 140094 | 887 | Other Mental Disorder Diagnoses | i103002503_HUMANA_CHOICE_POS_1817 | 10121.44 |
| … | … | … | … | … |
| 140094 | 887 | Other Mental Disorder Diagnoses | i103000613_ADVOCATE_HMOIBLUE_ADVANTAGE_OUTOFNE… | 10621.96 |
| 140094 | 887 | Other Mental Disorder Diagnoses | i103002204_HEALTHLINK_STATE_OF_ILLINOIS_1825 | 12405.05 |
| 140094 | 887 | Other Mental Disorder Diagnoses | i103004602_UHC_CHOICE_2126 | 12728.66 |
We have an example of one payer paying 90% less than another. Is this an example of fat-fingering something into the table (after all, who would know?) or is this a real contract?
Let’s table that question and look at the high end — which insurance companies are paying way above the average?
(
    source
    .filter(pl.col('id') == source[-1]['id'][0])
    .filter(pl.col('ms_drg') == source[-1]['ms_drg'][0])
    .select([
        'id',
        'ms_drg',
        'description',
        'payer_name',
        'standard_charge',
    ])
)| id | ms_drg | description | payer_name | standard_charge |
|---|---|---|---|---|
| 330045 | 796 | VAGINAL DELIVERY WITH STERILIZATION AND/OR D&C… | EmblemHealth Silver CSR 3 (Individual On/Off E… | 9645.0 |
| 330045 | 796 | VAGINAL DELIVERY WITH STERILIZATION AND/OR D&C… | EmblemHealth Silver Value CSR 3 (Individual On… | 9645.0 |
| 330045 | 796 | VAGINAL DELIVERY WITH STERILIZATION AND/OR D&C… | EmblemHealth Silver (Individual On/Off Exchange) | 9645.0 |
| … | … | … | … | … |
| 330045 | 796 | VAGINAL DELIVERY WITH STERILIZATION AND/OR D&C… | EmblemHealth PPO Value (Large Group-GHI) | 14106.0 |
| 330045 | 796 | VAGINAL DELIVERY WITH STERILIZATION AND/OR D&C… | Aetna Signature Administrators | 16331.0 |
| 330045 | 796 | VAGINAL DELIVERY WITH STERILIZATION AND/OR D&C… | Empire Federal Employee Program | 39499.0 |
This surprised me. Why would NYC’s Huntington Hospital be charging the most to Empire’s Federal Employee Program for vaginal deliveries? We’ll look into this in a future blog, but the main point here is to illustrate just how easy it is to make discoveries in this new dataset.
Future work#
If you’re a beginner, there’s good news. There are a lot of ways to cut your teeth on this data, whether you’re learning about data cleaning, data science, or healthcare data in general.
One challenge in using the data is matching these gnarly payer_name strings to actual insurance companies and contracts. These strings are unfortunately the best we’ve got — they’re how hospitals labeled their contracts. Believe it or not, there’s no complete database of either insurance companies or plans to match these strings to. That’s something we still have to work out.
It’s not too difficult to group payers by string, even if those strings are a bit messy. You can make a dictionary of substrings, and link those to a single, properly formatted string. Grouping by payer, after cleaning, could give you a sense of which payers are paying the most (or least) for services at different hospitals.
The approach might look something like
synonyms = {
    'United HealthCare': [
        'umr', 'uhc', 'optum', 'wellmed',
        'united', 'unhlcrgr', 'UnitedHealthcare',
        'unitedhealth', 'oxford health',
    ],
    'Anthem Blue Cross': [
        'bc bs', 'bcbs', '\\bbc\\b', 'florida blue',
        'empire', 'wellmark', 'blue advantage',
        'anthem', 'blue cross', 'blue shield',
        'amerigroup', 'amerihealth'
    ],
    ...
}

def payer_group():

    expr = pl

    for k, synonym_list in synonyms.items():
        for synonym in synonym_list:
            condition = pl.col('payer_name').str.contains(f'(?i){synonym}')
            expr = expr.when(condition).then(k)

    return expr.alias('payer_group')
You can also try to figure out which payers are secretly Medicare/Medicaid payers in disguise, by figuring out which payers often have rates within a few percent of known Medicare rates.
Or, you could try to do figure out which networks have better rates (and why?) (Think HMO vs PPO, etc.) The distribution of rates could be interesting. What do you expect?
Last words#
The hospital price database is one of the coolest things to come out of DoltHub’s idea tank this year, and we expect that sooner or later, as we’re better able to flesh out, clean, and augment the database, that it’ll be integrated into real products. The data is licensed under Creative Commons 4.0.
If you have other thoughts or questions, don’t hesitate to email me at alec@dolthub.com, or @spacelove on our Discord.