
Overview#
Not long ago we wrote about measuring Dolt’s performance against MySQL with the goal of improving Dolt to be no more than 2-4 times slower than MySQL.
To work toward this goal, we created a containerized tool that benchmarks supplied versions of Dolt against MySQL. We also began publishing updated results for the latest Dolt release on our documentation site.
This containerized benchmarking tool was the first step on our path to optimizing Dolt’s performance. Today, we are happy to reveal a feature we’ve added to our Dolt repository for our developer team that further empowers our performance optimization efforts—benchmarking reports on pull requests!
Motivation#
One of the challenges our developers face is generating consistent Sysbench performance results, even when testing the same Dolt version.
Despite testing in a containerized environment, operating system resource allocation, hardware differences, and benchmarking parameters all affect Dolt’s performance numbers. This makes meaningfully interpreting performance impacts pretty tough.
This variance we’ve seen in performance results motivated us to better control each of the variables that affect performance so that our developers get reliable, consistent measurements. We also wanted them to have a simple interface for running a standard suite of performance tests and viewing the results. This was where the idea for performance results on pull request was born.
The Feature#
Our new feature is defined as a Github Actions workflow. It enables our Dolt developers to comment on a pull request with “#benchmark” and, after a short time, see the performance results of their pull request compared to the performance results of master.
For our developers, using this feature looks something like this:
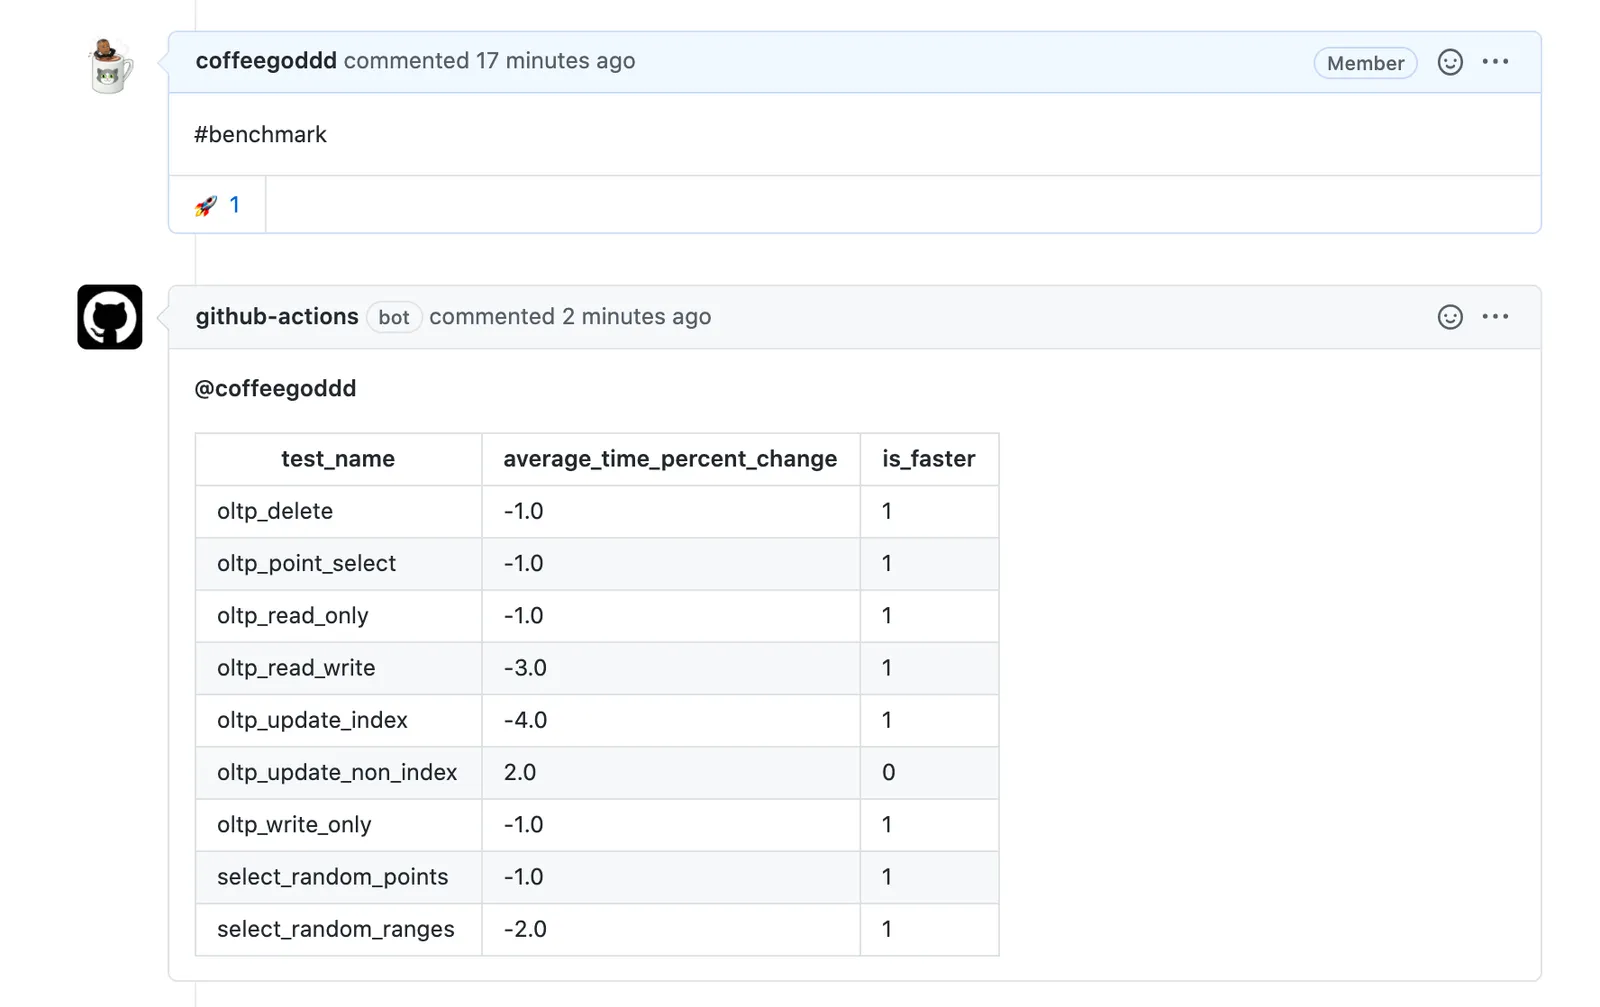
As you can see from the image, once the developer triggers the benchmarking workflow, the results are posted back to the pull request as a comment detailing the percentage change in test time between master and the pull request branch, for each test in our Sysbench test suite. The is_faster column makes it easy for our developers to see, at a glance, which test is faster or slower based on their changes.
To implement this, we started by redesigning our benchmarking tool to be more configurable, allowing our team to tune performance runs in a variety of ways. We also designed it to run natively on multiple platforms without requiring a containerized environment.
The redesigned benchmarking tool can benchmark two versions of Dolt N times, then average performance results across those runs. This helps minimize some of the variance we’d been experiencing before.
With the benchmarking tool in place, our next step was setting up a consistent runtime environment, one that allowed us to retain control over the hardware, software, and resource consumption within that environment.
We decided against using a Github Actions hosted runner and instead designed a way for our workflow to spin up a Dedicated Kubernetes Node used exclusively for benchmarking within our Virtual Private Cloud. Here is a simplified look how this works:
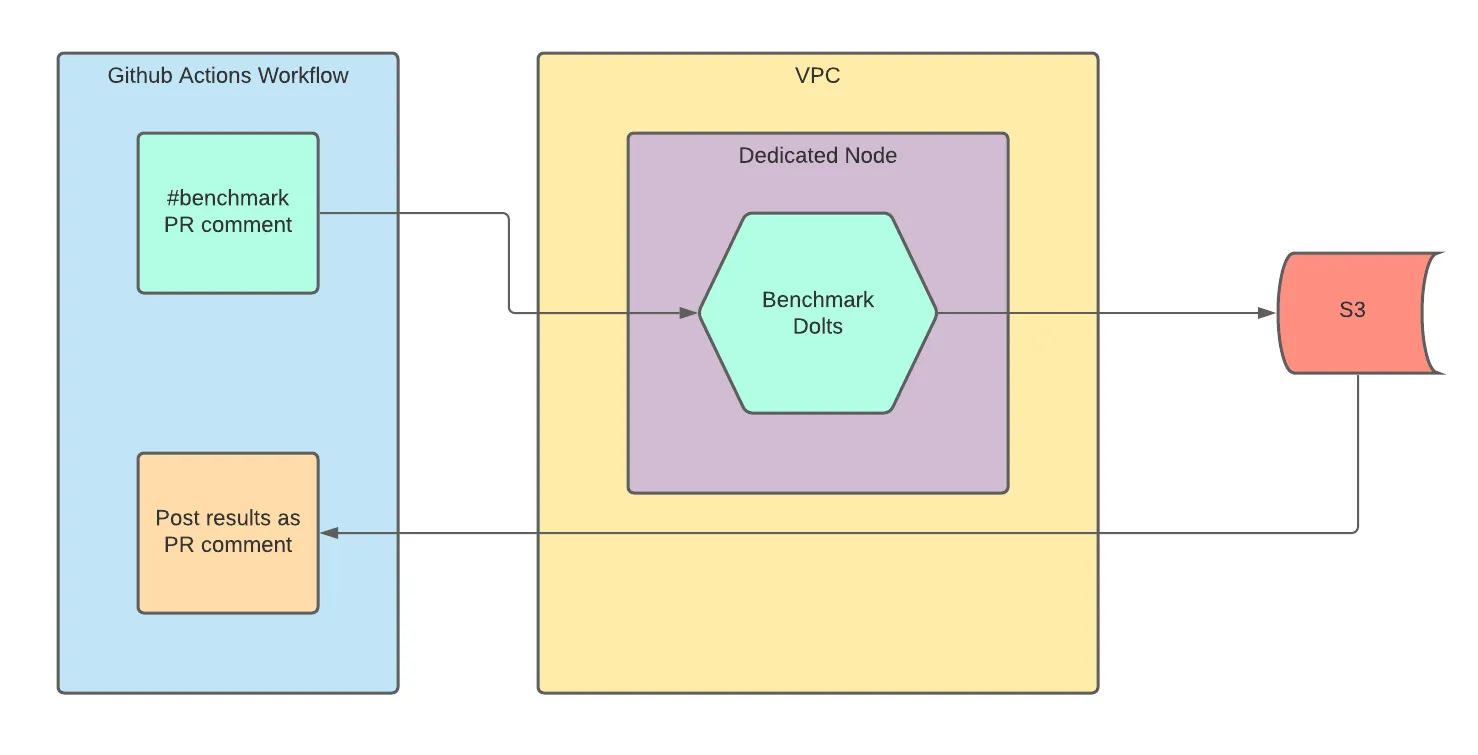
When our Github Actions detects a “#benchmark” PR comment, it spins up a dedicated node using the Kubernetes Cluster Autoscaler. The autoscaler detects that our workflow scheduled a new benchmarking job, and spins up a new node where only that job can run. This ensures the benchmark results won’t be affected by other Pods consuming the node’s resources.
When the benchmarking job is complete, the results are written to S3 as shown in the illustration. From there, the Github Actions workflow downloads the results from S3 and posts them back to the pull request as a comment, tagging the developer who requested the benchmarking results. Pretty cool, right!
Conclusion#
Our hope is that this new feature empowers our team to deliver more and more performance wins. We are committed to improving Dolt’s performance to meet the needs of our customers and are building out the infrastructure and internal tools that will enable us to do so.
Our next internal performance feature will be generating performance benchmarking reports with every Dolt release and emailing the results to our team. This will help us monitor performance impacts across releases and better communicate those impacts to our customers.
Curious about Dolt, DoltHub and the versioned database of the future? There’s no better place to get started than DoltHub.com where you can download Dolt, host your own public and private repositories, or just clone some amazing public repositories you won’t find anywhere else.
Questions, comments, or looking to start publishing your data in Dolt? Get in touch with our team here!