
In a previous blog I showed how the history of a dataset can be queried using the dolt history tables, and in the first part of this 2 part blog I covered the IRS SOI data. In this second part I use the IRS SOI data along with doltpy to map out income inequality across the US and look at how it’s changed over the 2011 through 2017 tax years.
The Goals and Methodology#
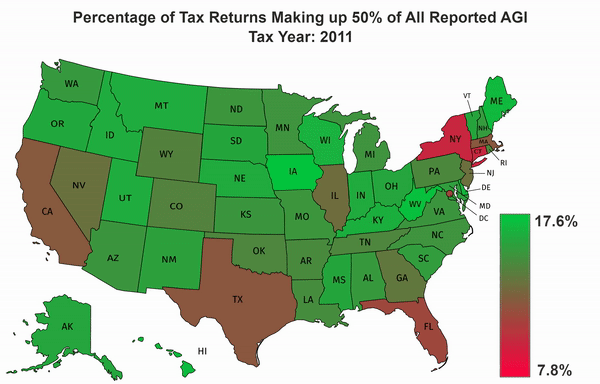
Using the IRS SOI data, I calculate an approximate percentage of the tax returns which make up half of all income for each state. I do this by first querying the allnoagi table for the ZIP code “00000” in order to get the totals for all zips in each state. I then query the allagi table to get the average income for each AGI category and the number of returns in that AGI category per ZIP code. I take the sorted list of average incomes across the state and find out the minimum number of returns which represent 50% of the income. Because I am using averages, this will only be an approximation.
Once I calculate those percentages, and the overall minimum and maximum percentage for all states across all years, I convert them to a format that can be used on https://mapchart.net/usa.html. I then import the files, and download the frames of the animation. The gradient, and title were added in GIMP and the animation was generated using FFmpeg.
The Results#
Setup#
Before I run the code, I install Dolt.
sudo curl -L https://github.com/dolthub/dolt/releases/latest/download/install.sh | sudo bashNext I clone the data into the directory where I want the data stored.
dolt clone dolthub/irs-soiThe code is in python so I need to have a working version of python 3. My program uses doltpy which I also install.
pip install doltpyThe Code#
Here I cover the sections of the code that query the data and process it. The code in its entirety is linked to at the end of this section. doltpy.core provides an interface for interacting with Dolt so we’ll start off by importing that.
import doltpy.core as dpcTo initialize a new dolt.core.Dolt instance, I pass in repo_dir which holds the directory that I cloned the
IRS SOI data into. After that I run db.start_server()
to start Dolt’s internal SQL server.
db = dpc.Dolt(repo_dir)
db.start_server()
I process a year at a time in the main loop. I switch the branch where necessary in order to be on the appropriate branch corresponding to the year being processed.
# loop through all the branches
min_percentage, max_percentage = 100, 0
for branch in BRANCHES:
    if db.get_current_branch() != branch:
        db.checkout(branch)
Now I query the state totals and initialize a new StateData object for each row.
        STATE_TOTAL_AGI_QUERY = '''
            SELECT state, adjusted_gross_income, return_count
            FROM allnoagi
            WHERE zip = '00000';'''

        # query the totals
        state_data = {}
        cursor = db.query_server(STATE_TOTAL_AGI_QUERY)
        rows = cursor.fetchall()
        cursor.close()

        # initialize a StateData object for each state based on totals
        for row in rows:
            state, agi, count = row[0], row[1], row[2]
            state_data[state] = StateData(state, agi, count)
Here I run query_server and get back a
mysql.connector.MySQLCursor
instance. rows = cursor.fetchall() retrieves the entire result set as a list of of tuples, after which I
close the cursor. I iterate through each tuple, where a tuple is one row from the result set, and create new
StateData objects to hold the state totals.
Now I query for the number of returns and the average AGI for each state, ZIP code, and AGI category sorted by the state, and average AGI. I add those in order to the StateData object which already holds the totals.
    PER_ZIP_AGI_QUERY = '''
    SELECT  state,
            zip,
            agi_category,
            adjusted_gross_income,
            return_count,
            CAST(adjusted_gross_income AS DECIMAL(48,16))/CAST(return_count AS DECIMAL(48,16)) AS avg_agi
        FROM allagi
        WHERE zip != '00000' AND return_count != 0
        ORDER BY state, avg_agi DESC;'''

    # query each zip and agi category
    cursor = db.query_server(PER_ZIP_AGI_QUERY)
    rows = cursor.fetchall()
    cursor.close()

    # add the zip data to each StateData object
    for row in rows:
        state = row[0]
        state_data[state].zip_data.append(row)
Finally I create a csv file which contains all the states and the percentage of the return count which make up half of
the state’s AGI. In order to make that calculation I call the calc_min_returns_with_half_agi method of each
StateData object.
    def calc_min_returns_with_half_agi(self):
        remaining = self.total_agi/2.0

        for curr_zip_agi in self.zip_data:
            if remaining > curr_zip_agi[AGI_COL_IDX]:
                remaining -= curr_zip_agi[AGI_COL_IDX]
                self.min_returns_with_half_agi += curr_zip_agi[RET_CNT_COL_IDX]
            else:
                avg_agi = curr_zip_agi[AVG_AGI_COL_IDX]
                self.min_returns_with_half_agi += int((float(remaining) + avg_agi - 0.1) / avg_agi)
                break
Now I keep a variable remaining which is the amount of AGI not represented by the current value of
min_returns_with_half_agi, I loop through each zip_data element and see if the AGI represented by this
row is greater or less than the AGI that still needs to be represented. If the total AGI for the row is less than
remaining then the entire return count is added. Otherwise I calculate the number of returns needed to represent
the remaining AGI based on the average AGI of the row. It’s important that the zip_data list is already in sorted order
based on the average AGI for this to work.
The code in its entirety can be found here.
The output of the script is 7 csv files which contain a row for each state, and the minimum percentage of the return count that accounts for half of the state’s AGI. It also spits out the overall minimum and maximum percentages across all states and years which is needed by the script that generates the map data.
csv_to_map.py takes these csv files and converts them to a json format which includes color information which can be imported by https://mapchart.net/usa.html to generate a map of the US with different colors for each state and Washington DC.
In Summary#
In this blog post we looked at how you can get data through doltpy into a python program. This also works for Jupyter notebooks, and doltpy has an interface for getting data directly into a pandas dataframe. This should allow you to integrate with numerous statistics, and ML packages.
Download and try Dolt today.